The Revenue Leak Report
The leaks start at the cart. Find them and 20x your revenue.
.png)
Introduction
Ecommerce teams spend most of their time trying to get customers to convert.
They optimize landing pages, refine product detail pages, test pricing, and iterate on checkout flows. What happens after the purchase is often treated as an afterthought.
We have data that tells you why it shouldn’t be. Across millions of sessions and thousands of ecommerce brands, the largest differences in performance do not only come from how well brands convert traffic. They also come from how effectively they monetize the moments after conversion.
17M
Sessions analyzed
50K+
Shopify brands
4x
Performance swing on the same offer
4 Chapters
One for every funnel stage
CH.
01
Checkout
CH.
01
Checkout
CH.
01
Checkout
CH.
01
Checkout

Chapter 1: Checkout
The difference between 3% and 12% conversion isn’t the offer.
The same type of offer can perform 4 times better or worse without any change in product, pricing, or audience. The difference comes down to how the decision is presented to the customer.
Checkout performance is not primarily driven by what you offer. It is driven by how easy you make it for the customer to say yes.

Key Takeaway
Checkout performance is not driven by what you offer. It is driven by how easy you make it for the customer to say yes.
Finding 01
Mobile vs Desktop Has Almost No Impact
Mobile
0.62%
13.6M Sessions



Desktop
0.75%
3.4M Sessions
That gap is not structural. In some weeks mobile leads; in others desktop does.
Device-specific offer strategies are not warranted — optimize for placement and offer relevance instead

Upsell is not a dirty word! There can be a lot of hesitancy and overthinking around upsells (speaking from experience). While every brand should test and find what works for them, upsells can be an integral part of your strategy. We've unlocked meaningful incremental revenue through post-purchase upsells — and in a world where CAC is king, it's a powerful tool to recoup cost and drive AOV.

Will Moran
Ridge



The fastest way to apply this report is to connect it to your own data
Connect this report to Claude, Perplexity or ChatGPT and compare it with your own checkout data.
Am I underpricing my post-purchase offers based on my AOV?
Should I be adding more steps to my post-purchase funnel?
Where am I leaving revenue on the table in my current funnel?
What offers should I test next based on my product catalog?
Am I optimizing for conversion rate or total revenue? Which should I prioritize?
What would a 3-step funnel look like for my store based on this data?

Finding 02
Where you place the offer
changes everything
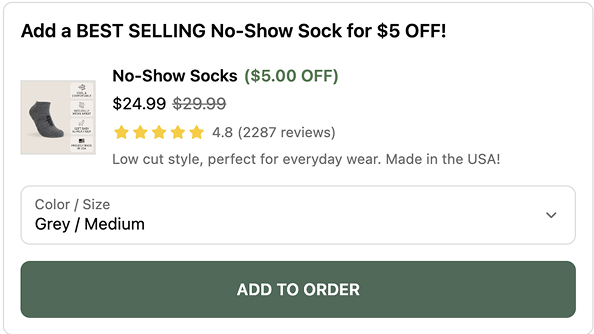
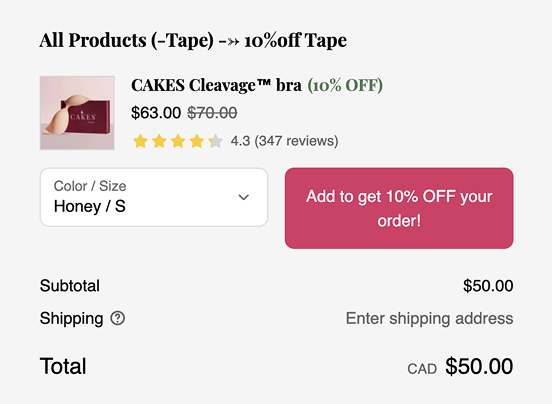

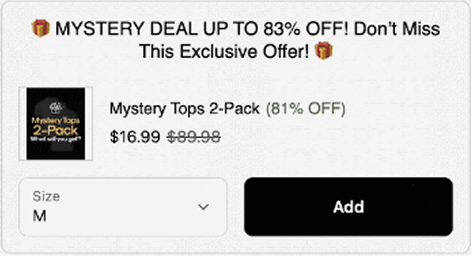
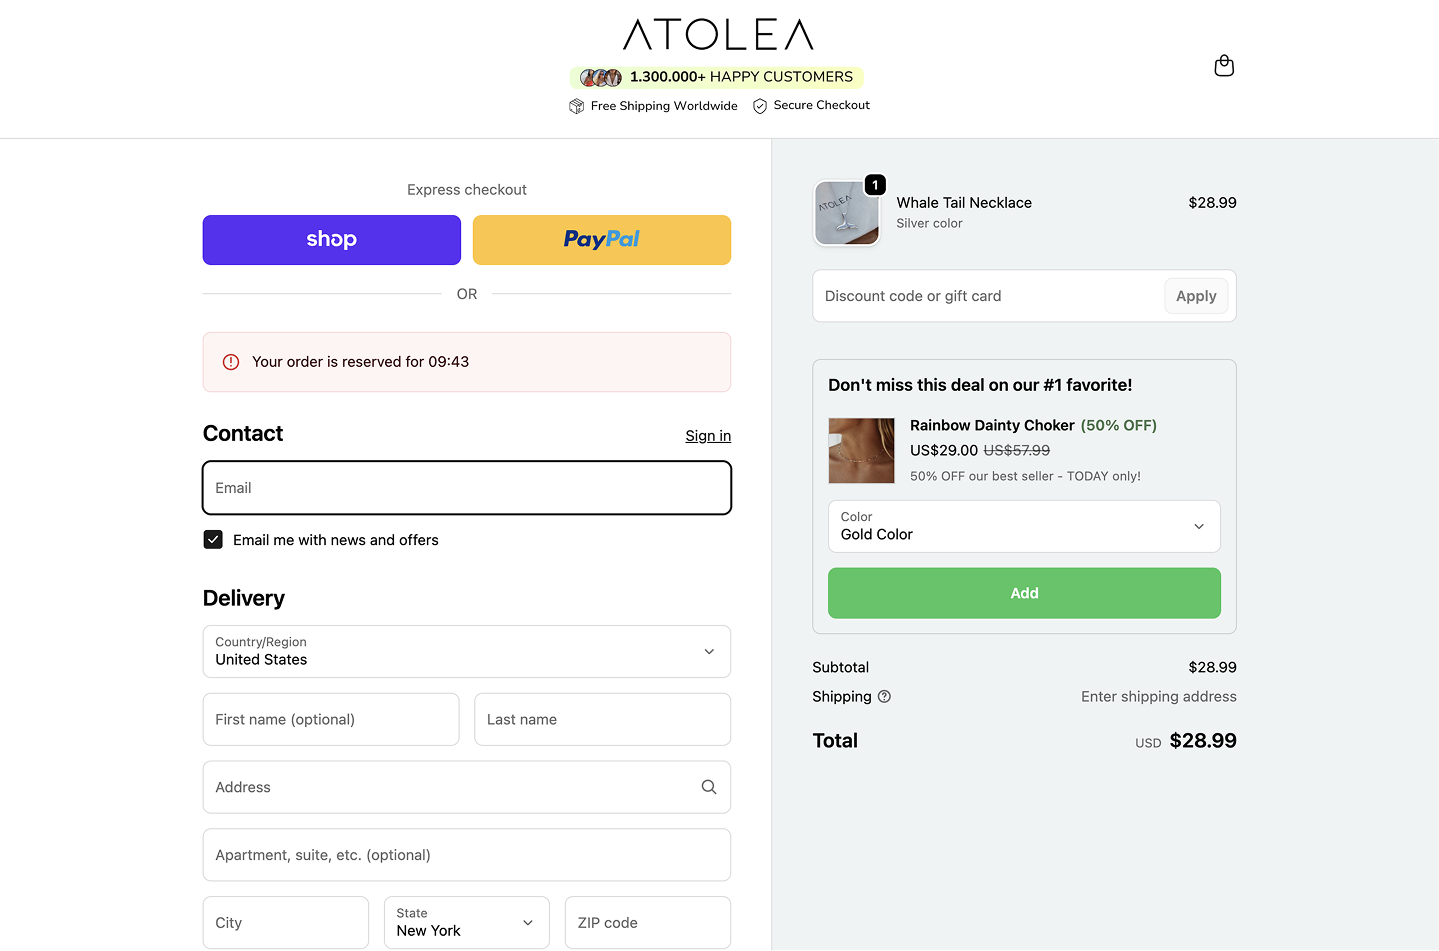
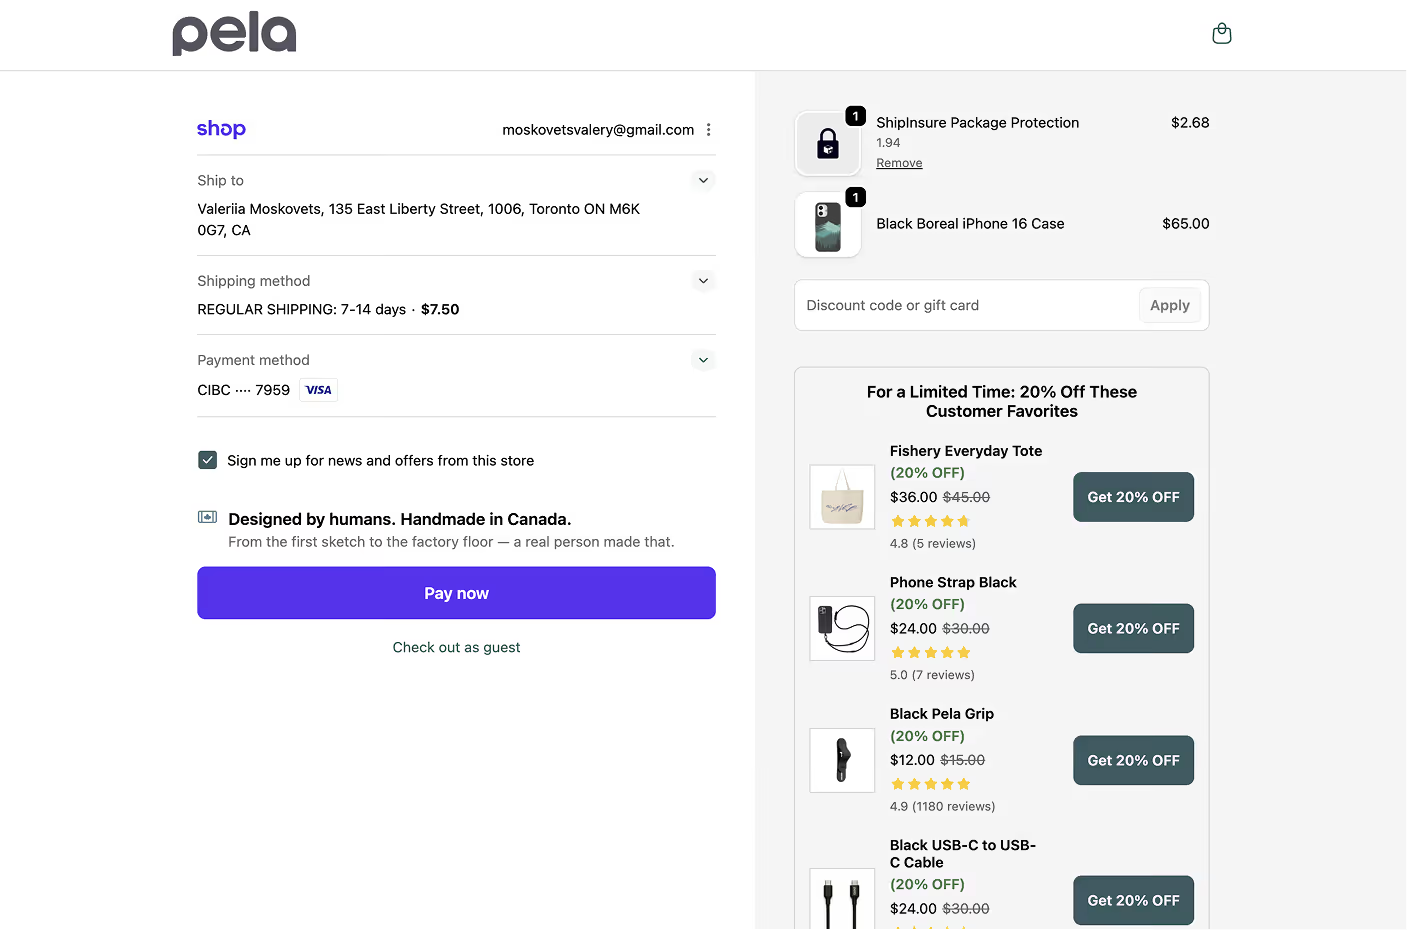
The same offer placed at different points in the checkout flow produces large swings in performance ranging from 6.96% down to 0.18%.

Key Takeaways
Pro Tip
The default checkout placement (Aftersell's standard upsell placement embedded on checkout pages) converts less frequently, but the customers who do accept an offer spend significantly more, with the highest average order value at $43.58. That makes it well-suited for higher-ticket upsells that customers are willing to spend a little more time evaluating. Lower-friction, impulse purchases perform better in other placements, but more considered offers can generate greater revenue per accepted purchase here.
$43.58 AOV
More total rev per 1000 impressions
Pro Tip
If you want the highest click-through rate, place the offer right before the "Complete Order" button. Customers in final-decision mode are primed to add one more thing. The tradeoff is a lower AOV, making this ideal for low-friction impulse items.
$8.62 AOV
3.4% purchase CVR
Finding 03
A Single Relevant Offer
Outperforms a Menu of Options

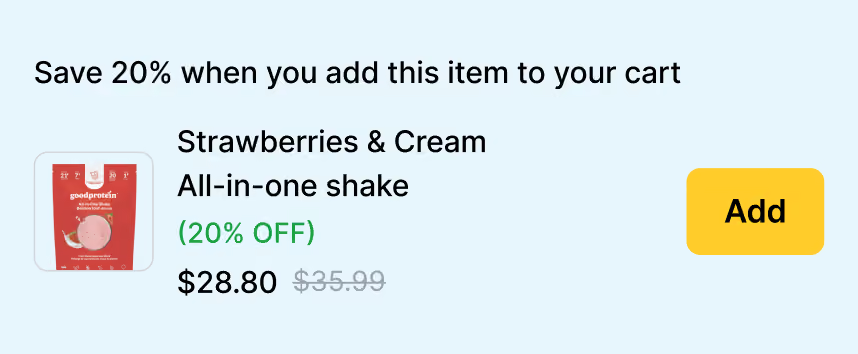
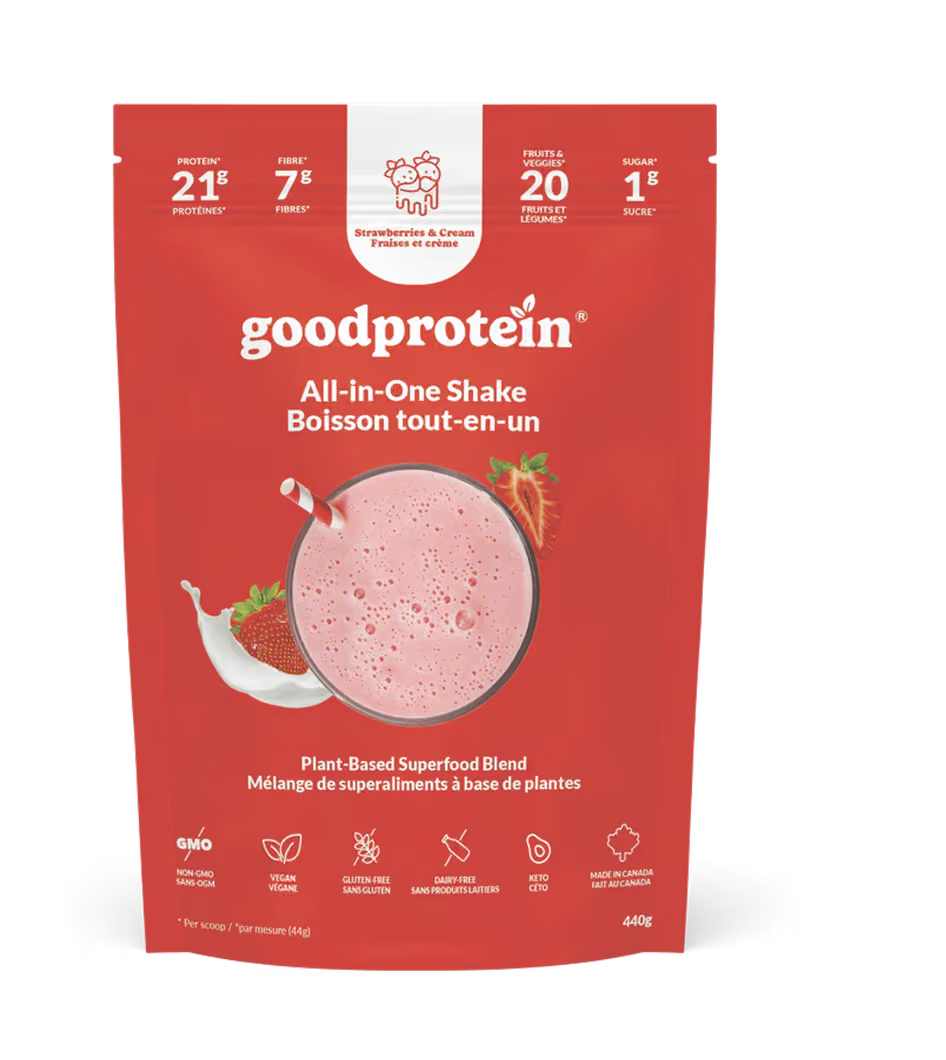

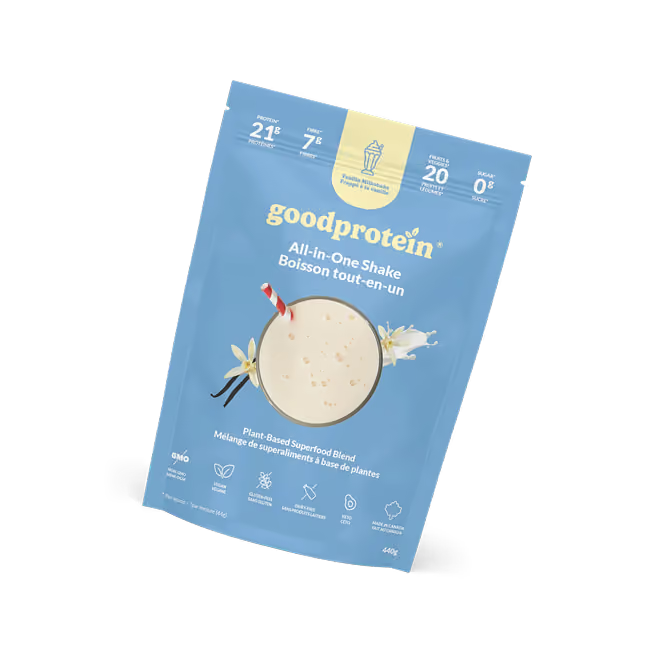

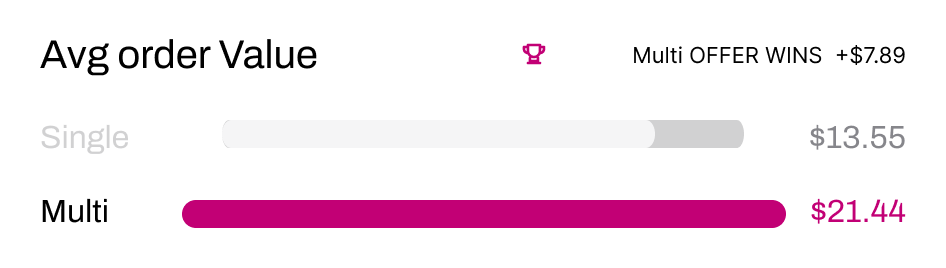
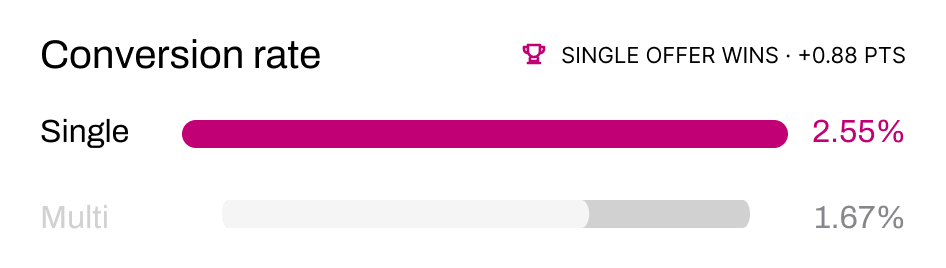
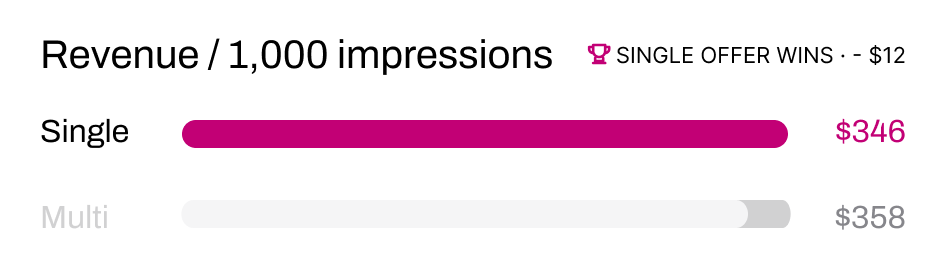
Single vs multi-product isn't about better.
It's about what you're optimizing for:
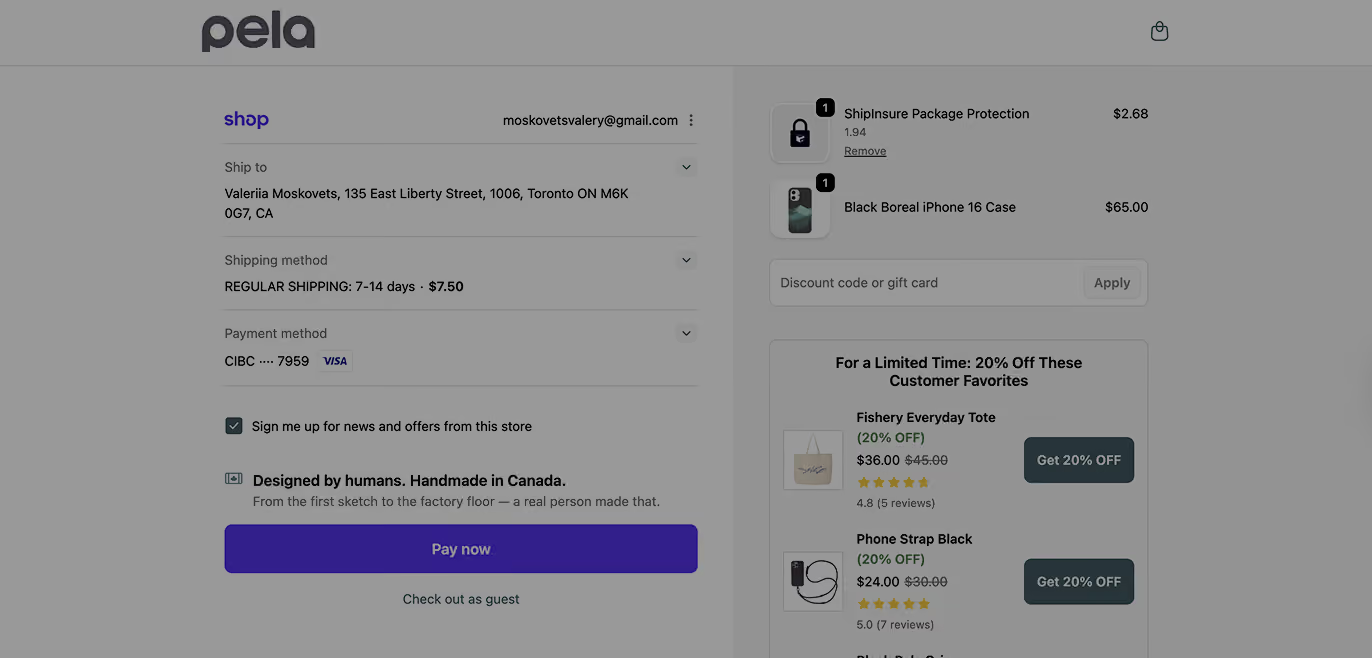
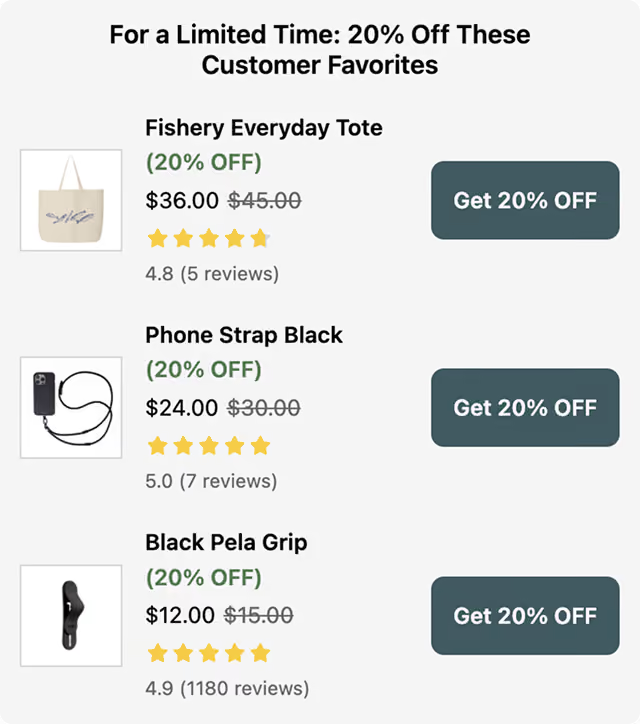
Single-offer placements have a 53% higher CVR (2.55% vs 1.67%) — fewer choices, faster yes
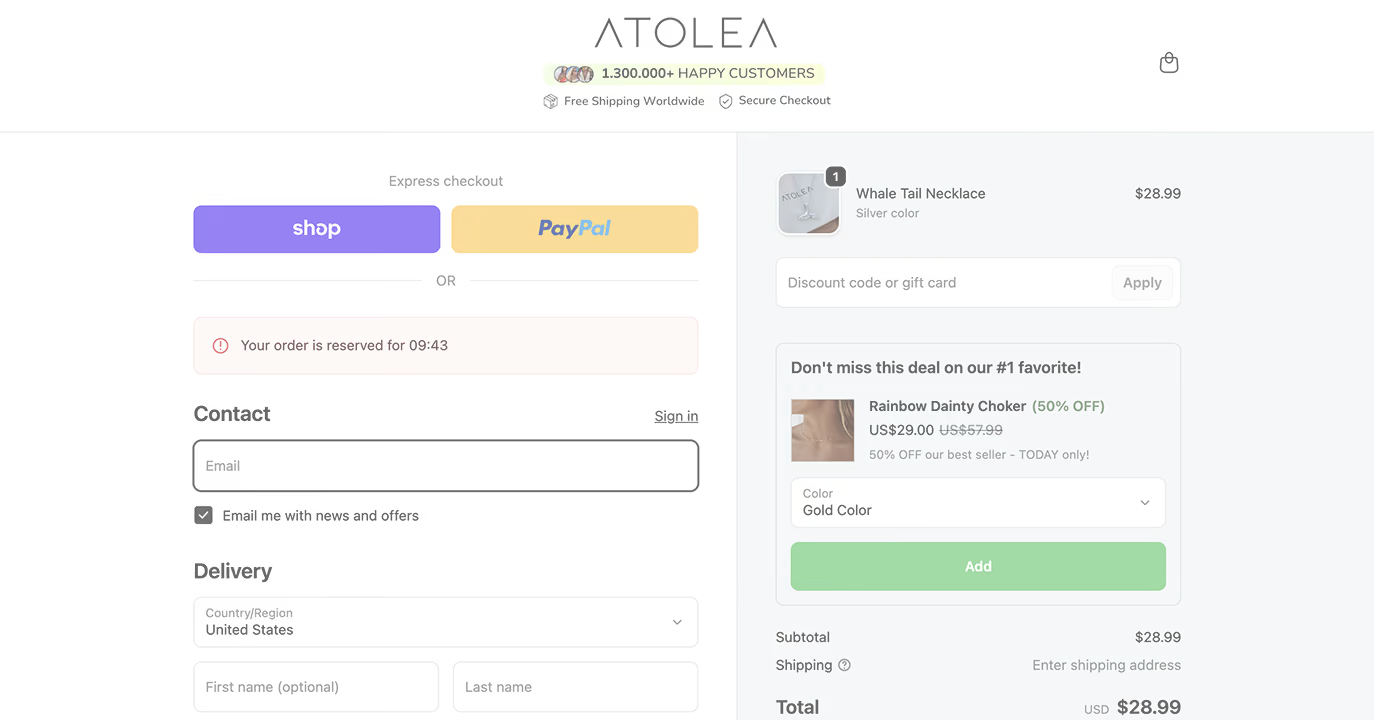
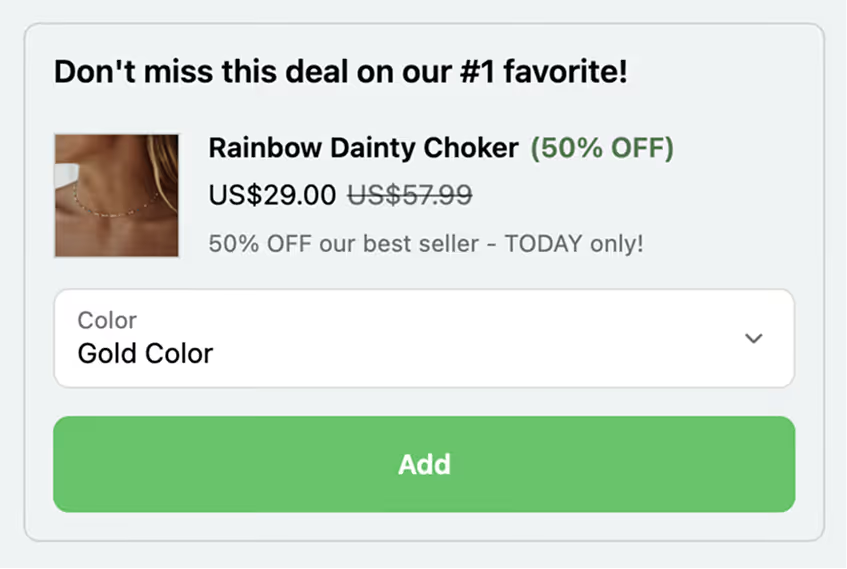
Multi-offer placements have a 58% higher AOV ($21.44 vs $13.55) — when customers do convert, they pick a more valuable item
The fastest way to apply this report is to connect it to your own data
Connect this report to Claude, Perplexity or ChatGPT and compare it with your own checkout data.
Am I underpricing my post-purchase offers based on my AOV?
Should I be adding more steps to my post-purchase funnel?
Where am I leaving revenue on the table in my current funnel?
What offers should I test next based on my product catalog?
Am I optimizing for conversion rate or total revenue? Which should I prioritize?
What would a 3-step funnel look like for my store based on this data?
Finding 04
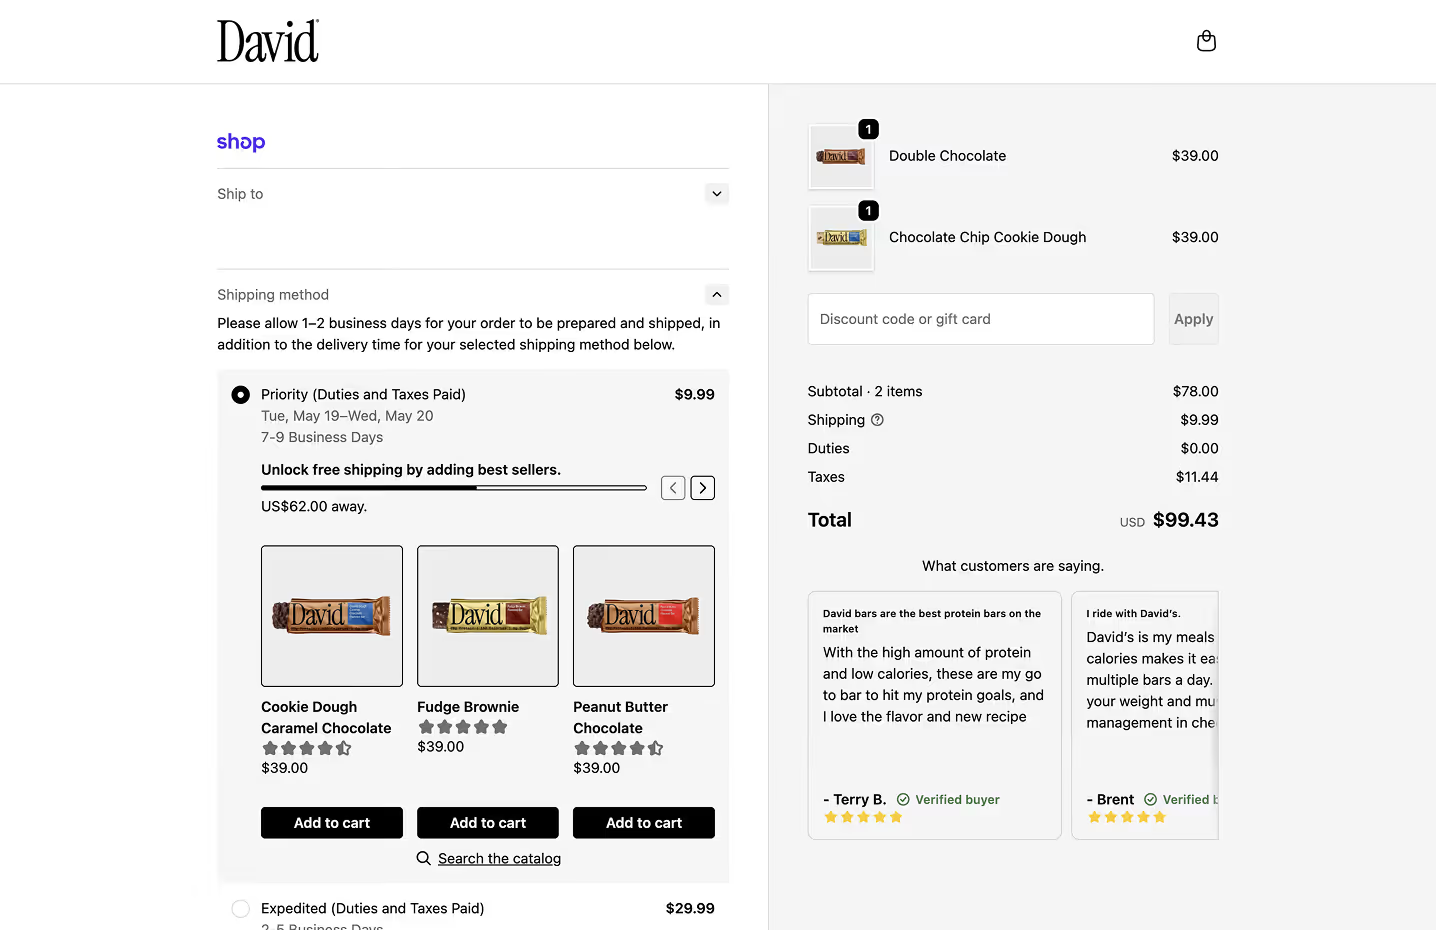
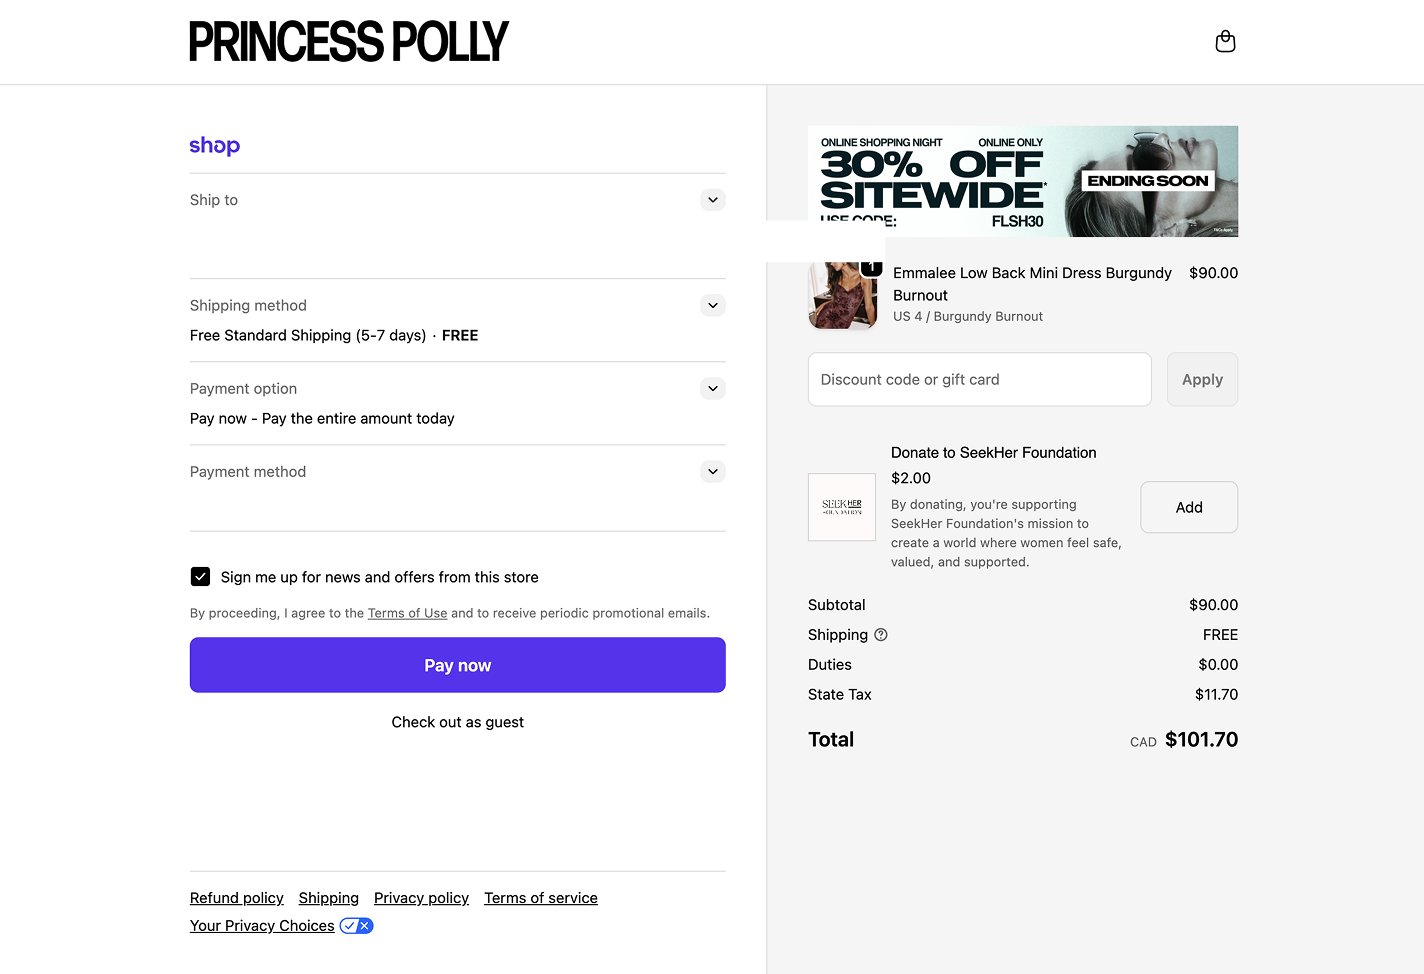
Industry Impacts Performance, but Not as Much as
Decision Design









“Focus on the upsell strategy that generates the most profit per order. Start with more of the same product, then offer complementary or related products, followed by different items or low-cost digital add-ons. Tools like Aftersell and Rokt make it easier to test these offers and add incremental profit, potentially increasing AOV by 25–50% while supporting higher acquisition spend and repeat purchases.”

Chuckie Gregory
Primal Queen
What The Best Performing Brands
Do Differently
Across the dataset, a small group of merchants consistently outperforms the baseline. Their results are not explained by volume or vertical. They come from a different approach to how checkout is treated as part of the funnel.
01
02
03
04
Pattern 01
They reduce the effort required to say yes
Instead of presenting a single product with a binary choice, they:
- introduce multiple options to increase the likelihood of relevance
- use low-friction interactions such as checkboxes where appropriate
- minimize the number of steps required to add an item
Pattern 02
Align offers to moments of highest intent
Top-performing brands prioritize:
- final decision moments, where adding an item feels natural
- positions that do not interrupt high-focus tasks such as payment entry
They avoid placements that introduce friction at the point of completion, even if those placements are technically available.
Pattern 03
They optimize for revenue, not just acceptance rate
Top-performing brands prioritize:
- high acceptance, lower-value offers
- lower acceptance, higher-value offers
They make deliberate decisions about:
- where to place lower-cost, impulse add-ons
- where to introduce higher-ticket upsells that require more consideration
Pattern 04
They move beyond default configurations
Top-performing brands treat checkout upsells as a configurable system, not a static feature. They:
- test different layouts and interaction models
- introduce more advanced configurations
- iterate based on performance rather than leaving the setup unchanged
CH.
02
Post-purchase
CH.
02
Post-purchase
CH.
02
Post-purchase
CH.
02
Post-purchase
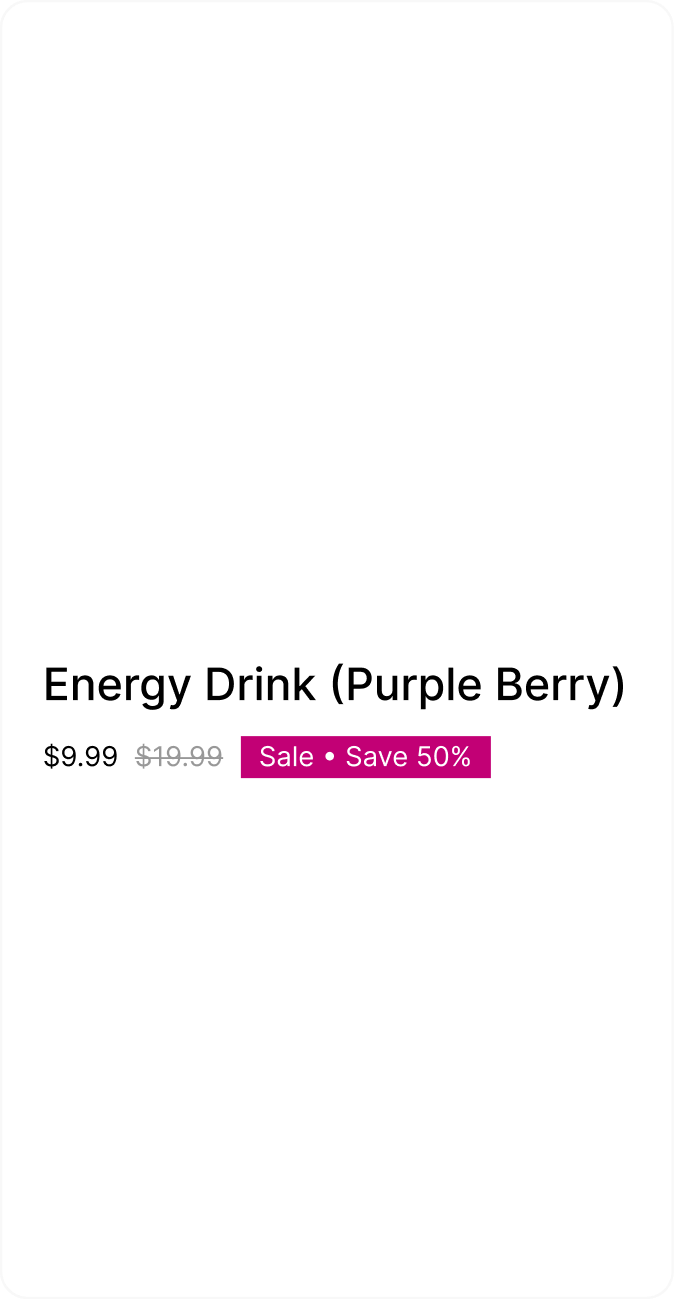
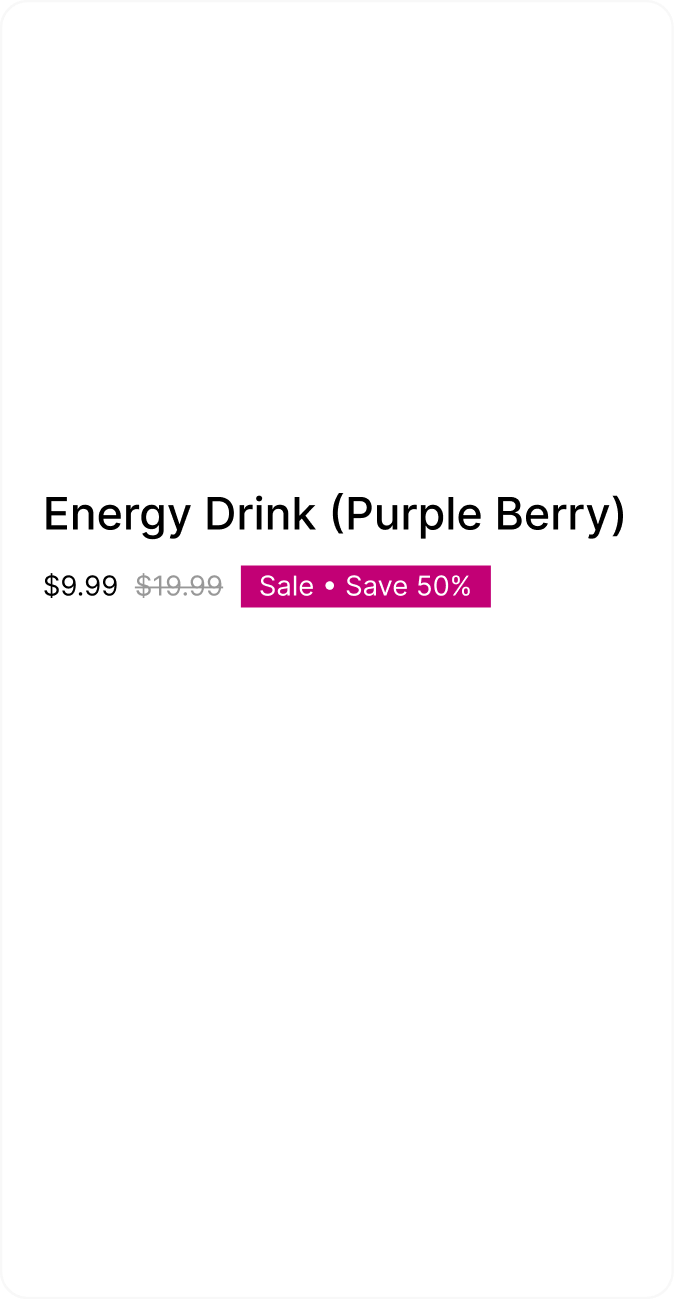
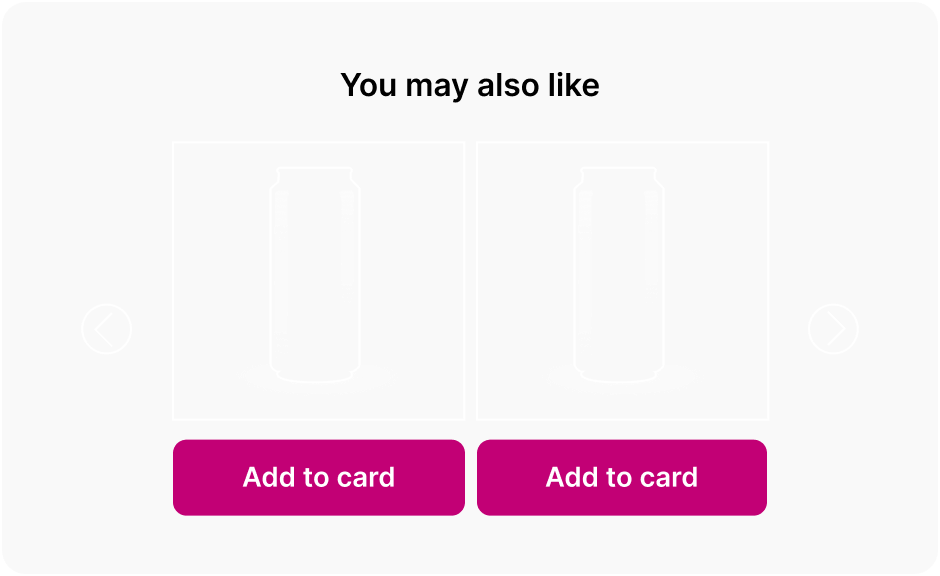

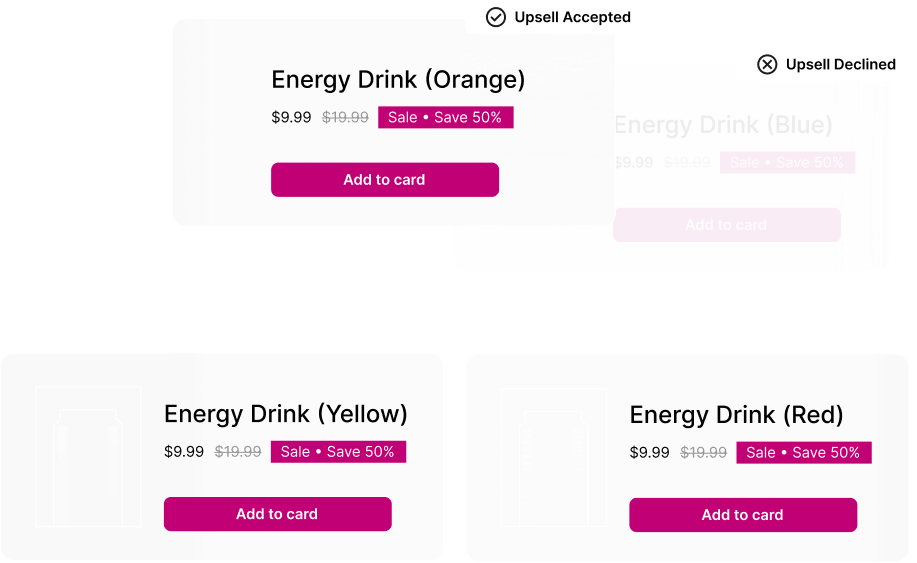
Chapter 2: Post-purchase
Post-purchase is actually the moment customers are most likely to buy again. But only if you can match the intent they already have.
The same type of offer can perform 4x better or worse without any change in product, pricing, or audience. The difference comes down to how the decision is presented to the customer. Most brands treat the moment after checkout as the end of the funnel.
The assumption is simple: the buying moment is over, right?
Wrong.
Key Takeaway
Customers remain highly willing to purchase after checkout. Conversion rates are not only strong, they are remarkably consistent across merchants, industries, and time.

One of the most common assumptions about post-purchase monetization is that it requires a long optimization window before meaningful results appear.
The data does not support that.
Post-purchase is not a channel that needs to “warm up” before it works. Optimization improves outcomes over time, but the underlying buying intent is already present from day one.

Continuous testing is critical, from product selection and offer structure to copy and creative. Relevance is everything. If there’s a seasonal or holiday moment, reflect that in your messaging and banners to make the offer feel timely. We’ve also learned to prioritize products that support LTV, not just immediate AOV gains. For example we analysed our average cart items and found that people who add our Multi-vitamin to cart have a higher LTV, once we translated it to a post-purchase offer, it became our most successful test yet.

Wealth Moses
Black Girl Vitamins
Finding 02
The Funnel Gets Stronger the Deeper It Goes
01
02
03
Acceptance rate increases at steps 2 and 3, not decreases.
The reason is self-selection: customers who reach step 2 or 3 have already said yes once, making them higher-intent buyers.
This means the funnel rewards depth, which is the opposite of how most funnels behave.
In traditional ecommerce flows, conversion typically decreases as customers move further through a sequence. Each additional step introduces friction and drop-off.
Post-purchase behaves differently. Customers who accept the first offer are not becoming fatigued. They are becoming more qualified.
Finding 03
Downsells Recover Revenue From Customers Who Said No
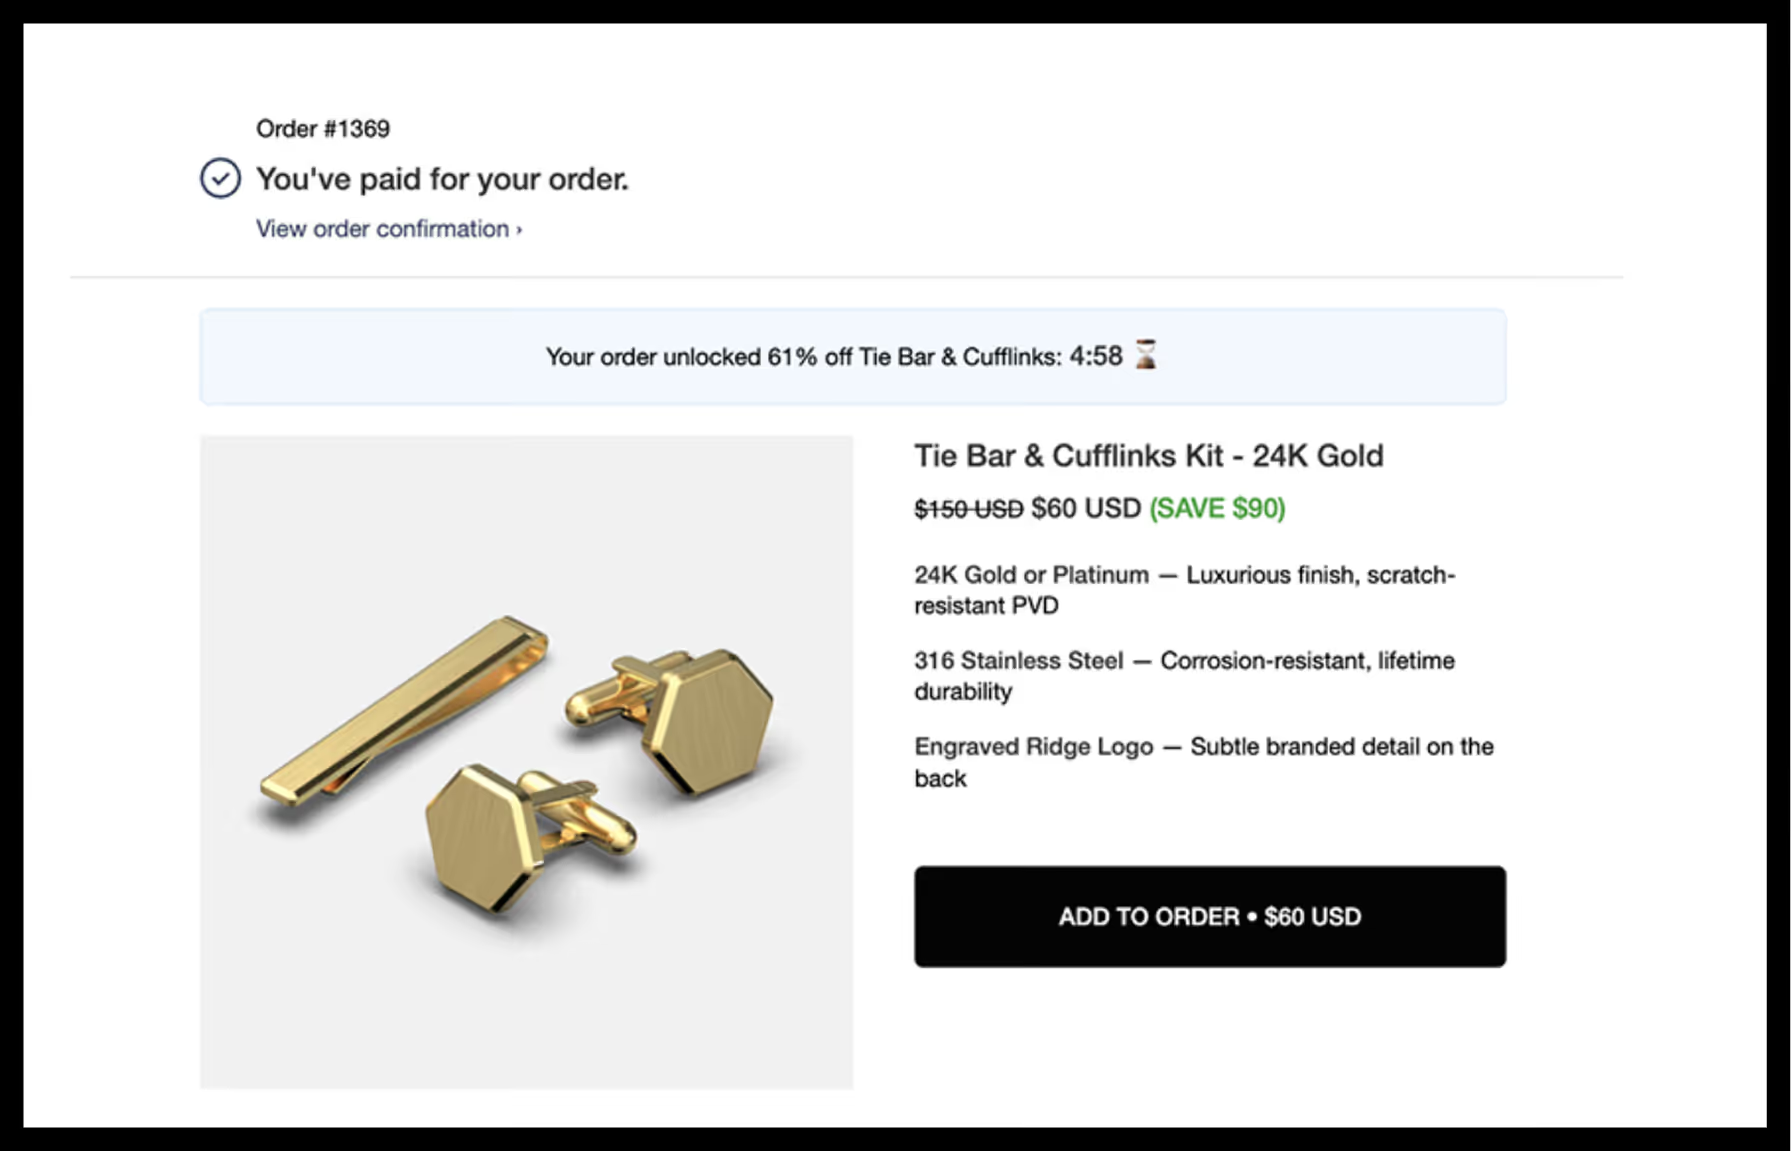
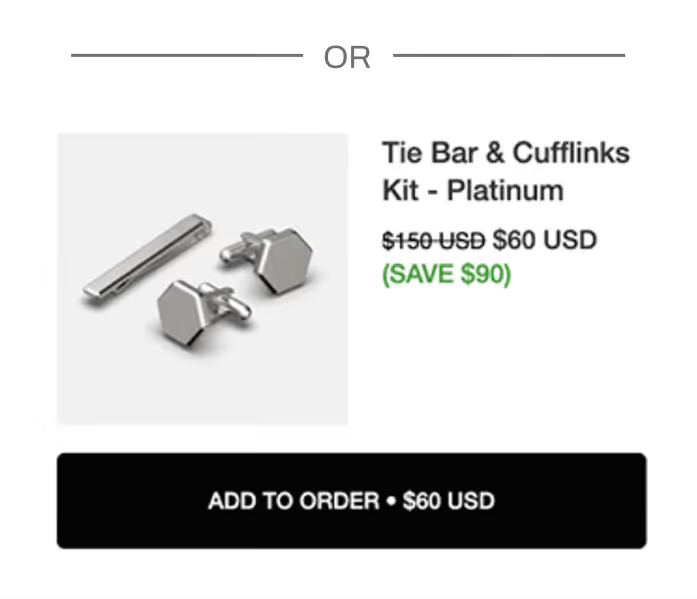

Over 600,000+ customers who said no to the first offer still converted via a downsell. That's $25.7M that would have been $0 without a second ask.
The downsell AOV is lower ($40 vs $67 for step 1), but it works precisely because it meets the customer at a lower willingness to pay rather than losing them entirely.
5.54%
Downsell CVR
4.33%
Recovery rate
on all decliners
$40
Downsell AOV
vs $67 at Step 1
78.1%
Decliners shown
a downsell
Finding 04
Discount Depth vs Acceptance Rate
Secret Tactic
Offering the most expensive relevant product converts at virtually the same rate as offering the cheapest, but generates more revenue for the same number of customers saying yes.
Also, higher discounts drive higher acceptance. But the most interesting data point is that offering no discount at all outperforms a small discount.

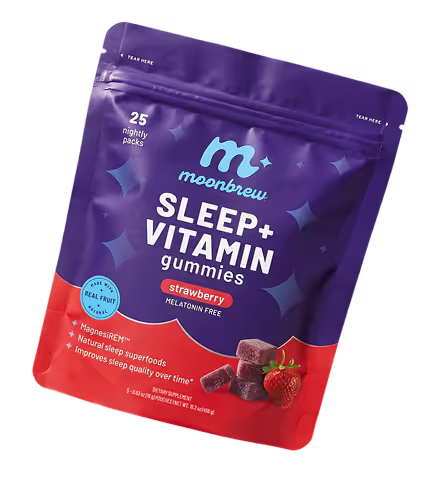
Offering customers another product that can help them doesn’t diminish the brand. We thought no one would want to buy another flavor of powder. But when we sold them the same product in a different flavor, that doubled or tripled our revenue per visitor. Customers think, ‘Wait, yeah, I just bought a one-pack. Let me get a two-pack at a discount.’ That logic and consumer behavior is there.

Ronak Patel
President, Moonbrew

Key Takeaways
Pro Tip
Higher-spending customers are inherently more likely to say yes to an additional offer, and offer relevance to the original purchase likely matters more than the discount level alone.
Pro Tip
Lower-priced offers do not meaningfully increase acceptance compared to higher-priced ones. The data shows that customers who just completed a purchase don't need to be eased in with a low-ticket offer. They're already in buying mode.
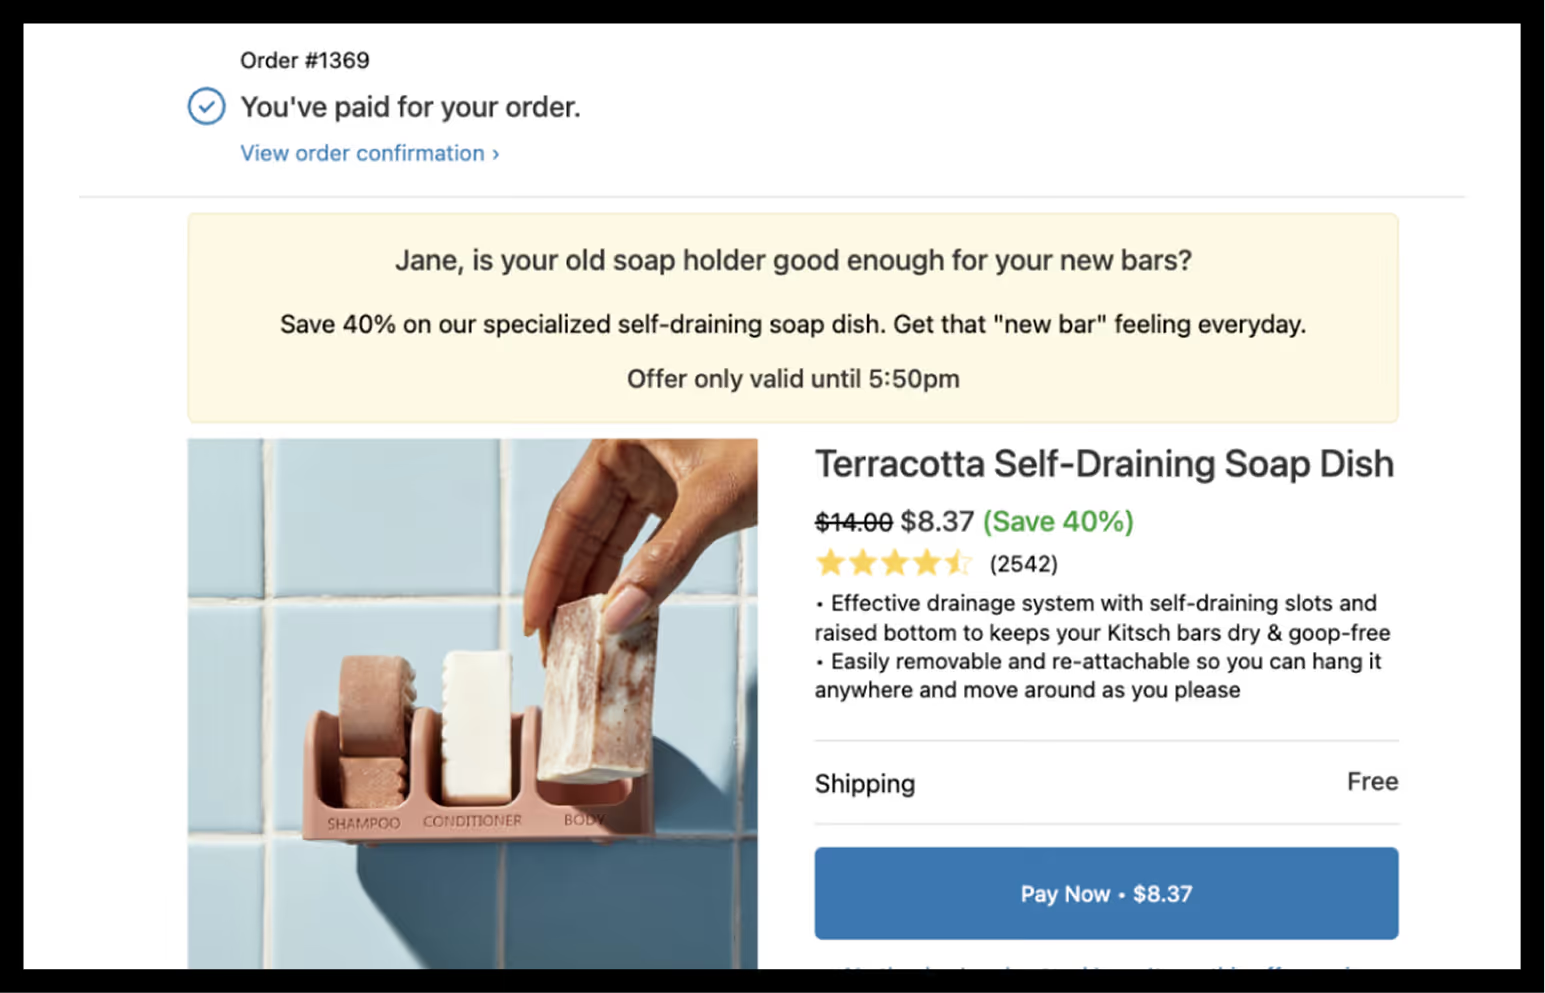




Finding 05: Data from

Loyalty & Rewards Are the Strongest Action in Post Purchase Surveys
Most brands treat the post-purchase survey as a feedback form.
The data shows it's also a revenue surface.
In the last 30 days, KnoCommerce surveys carried CTAs for loyalty enrollment, refer-a-friend, app downloads, social follows, and discount reveals.
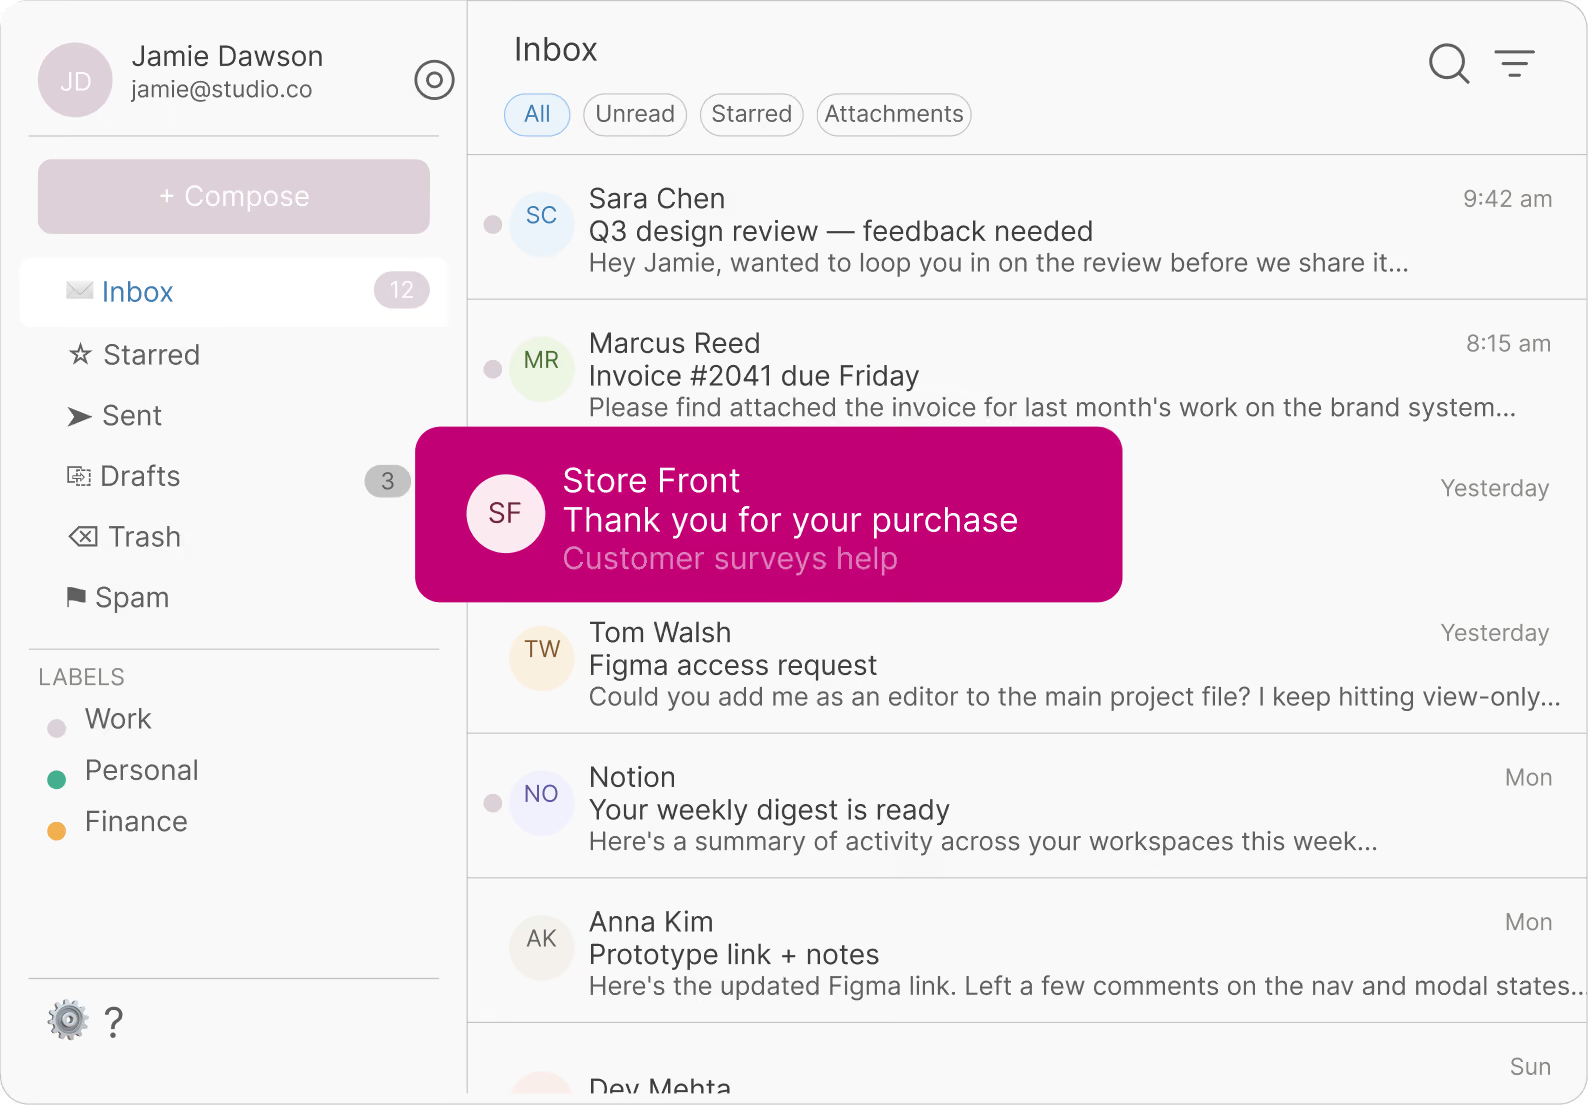
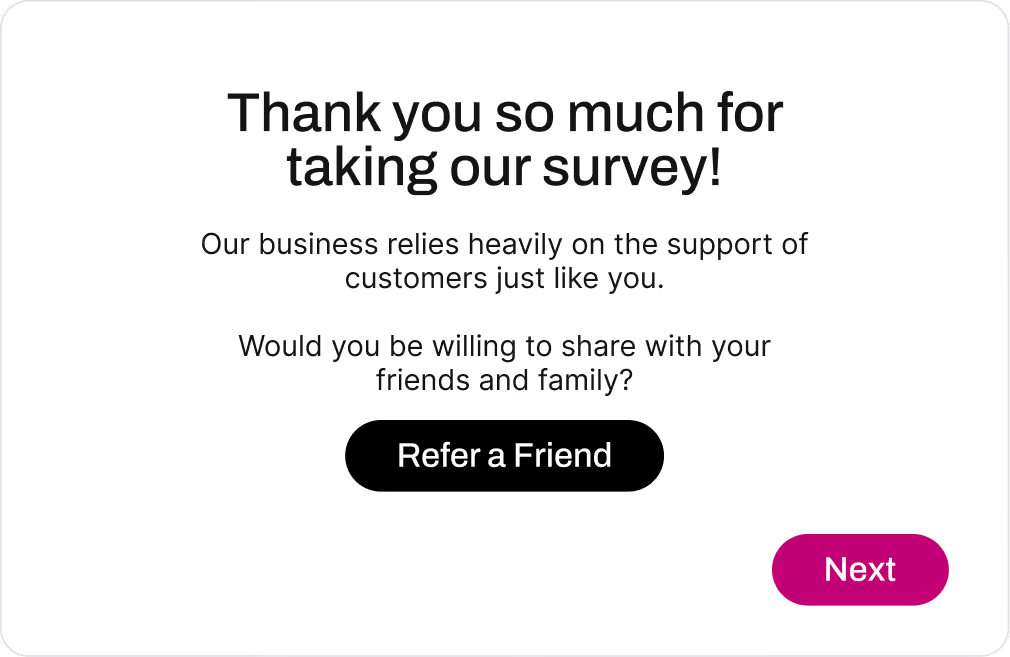
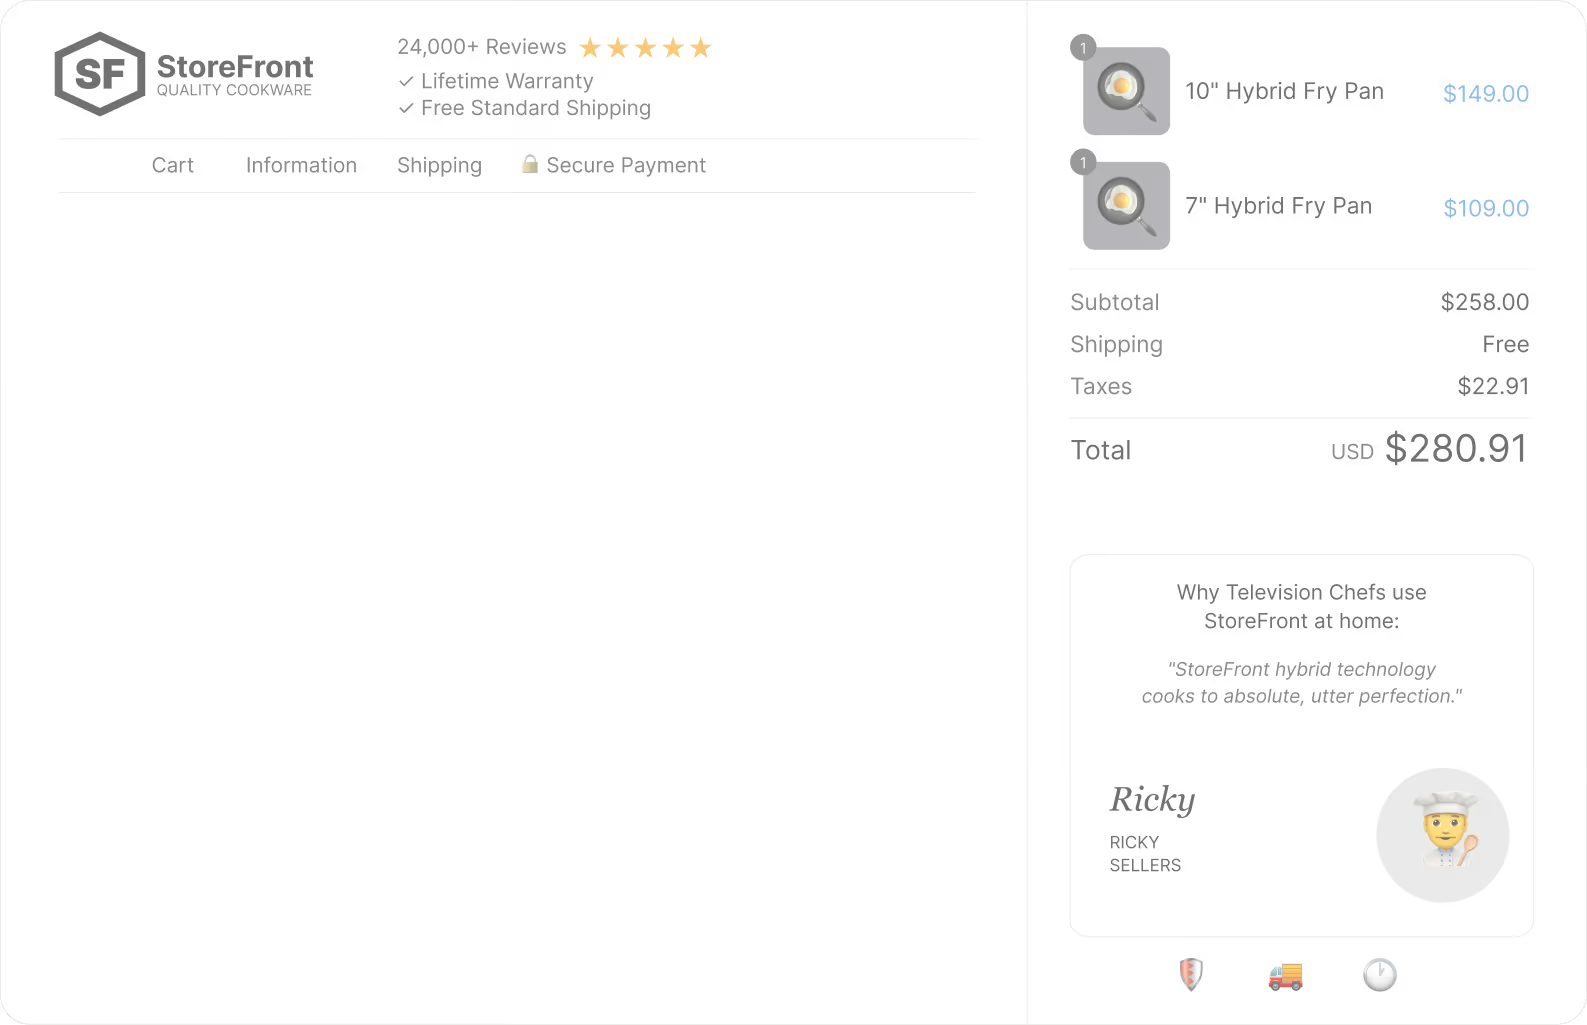
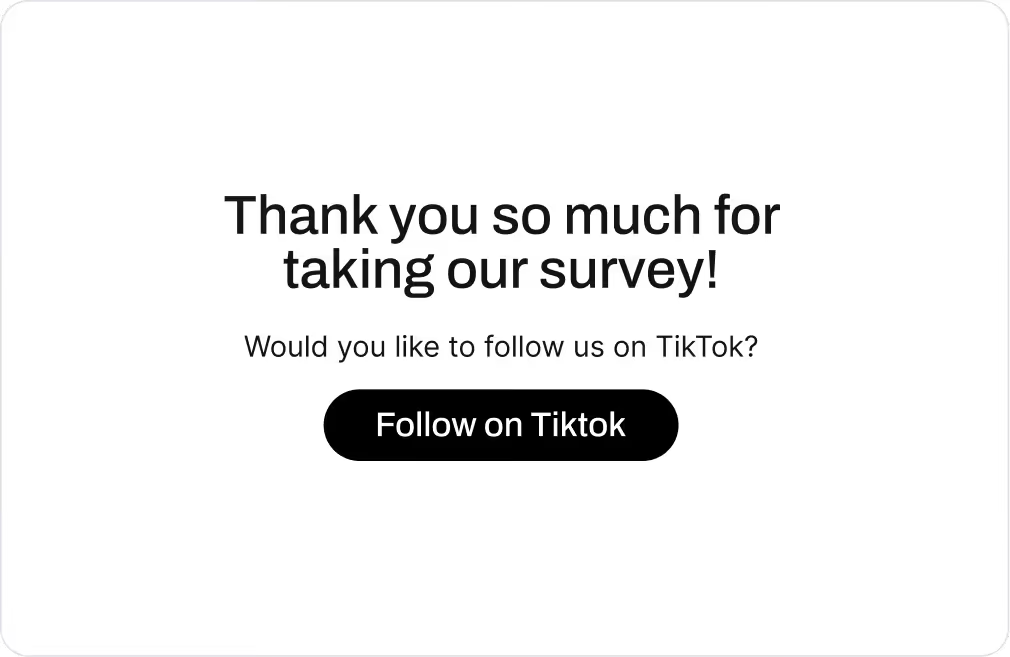

The most-adopted action is the social follow, running on 57% of the brands with this feature enabled. However, Loyalty/Rewards drives a 24% CTR and discount codes drive 20%, both outperforming social follows 17%.
The bigger finding: 66% of brands run exactly one CTA and 20% run zero, using the survey as a thank-you screen with no action attached. Only 14% stack two or more. The same principle that Aftersell’s checkout and post-purchase data establishes applies here. Structure drives performance more than category, and most brands aren't structuring this page at all.
What Top-Performing Brands Do Differently
Top-performing brands are not trying to create demand after checkout. They are recognizing that demand is already there, and designing their funnels to capture it more completely.
01
02
03
04
Pattern 01
They reduce the effort required to say yes
Instead of presenting a single product with a binary choice, they:
- introduce multiple options to increase the likelihood of relevance
- use low-friction interactions such as checkboxes where appropriate
- minimize the number of steps required to add an item
Pattern 02
Align offers to moments of highest intent
Top-performing brands prioritize:
- final decision moments, where adding an item feels natural
- positions that do not interrupt high-focus tasks such as payment entry
They avoid placements that introduce friction at the point of completion, even if those placements are technically available.
Pattern 03
They optimize for revenue, not just acceptance rate
Top-performing brands prioritize:
- high acceptance, lower-value offers
- lower acceptance, higher-value offers
They make deliberate decisions about:
- where to place lower-cost, impulse add-ons
- where to introduce higher-ticket upsells that require more consideration
Pattern 04
They move beyond default configurations
Top-performing brands treat checkout upsells as a configurable system, not a static feature. They:
- test different layouts and interaction models
- introduce more advanced configurations
- iterate based on performance rather than leaving the setup unchanged



“86% of brands in Knocommerce’s dataset run one CTA or fewer. A single low-CTR action is the default setup, not the optimized one.”
Jeremiah Prummer
CEO of Knocommerce
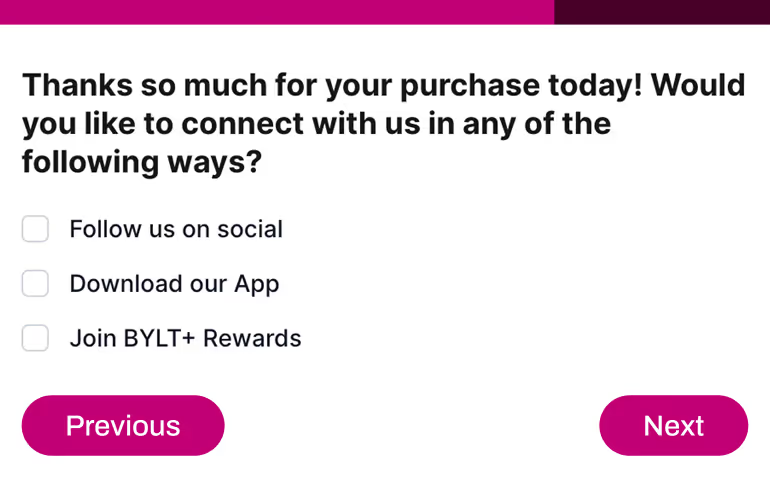
BYLT Basics runs three actions in a single survey screen, giving buyers multiple ways to engage without adding friction.
CH.
03
Thank You
CH.
03
Thank You
CH.
03
Thank You
CH.
03
Thank You
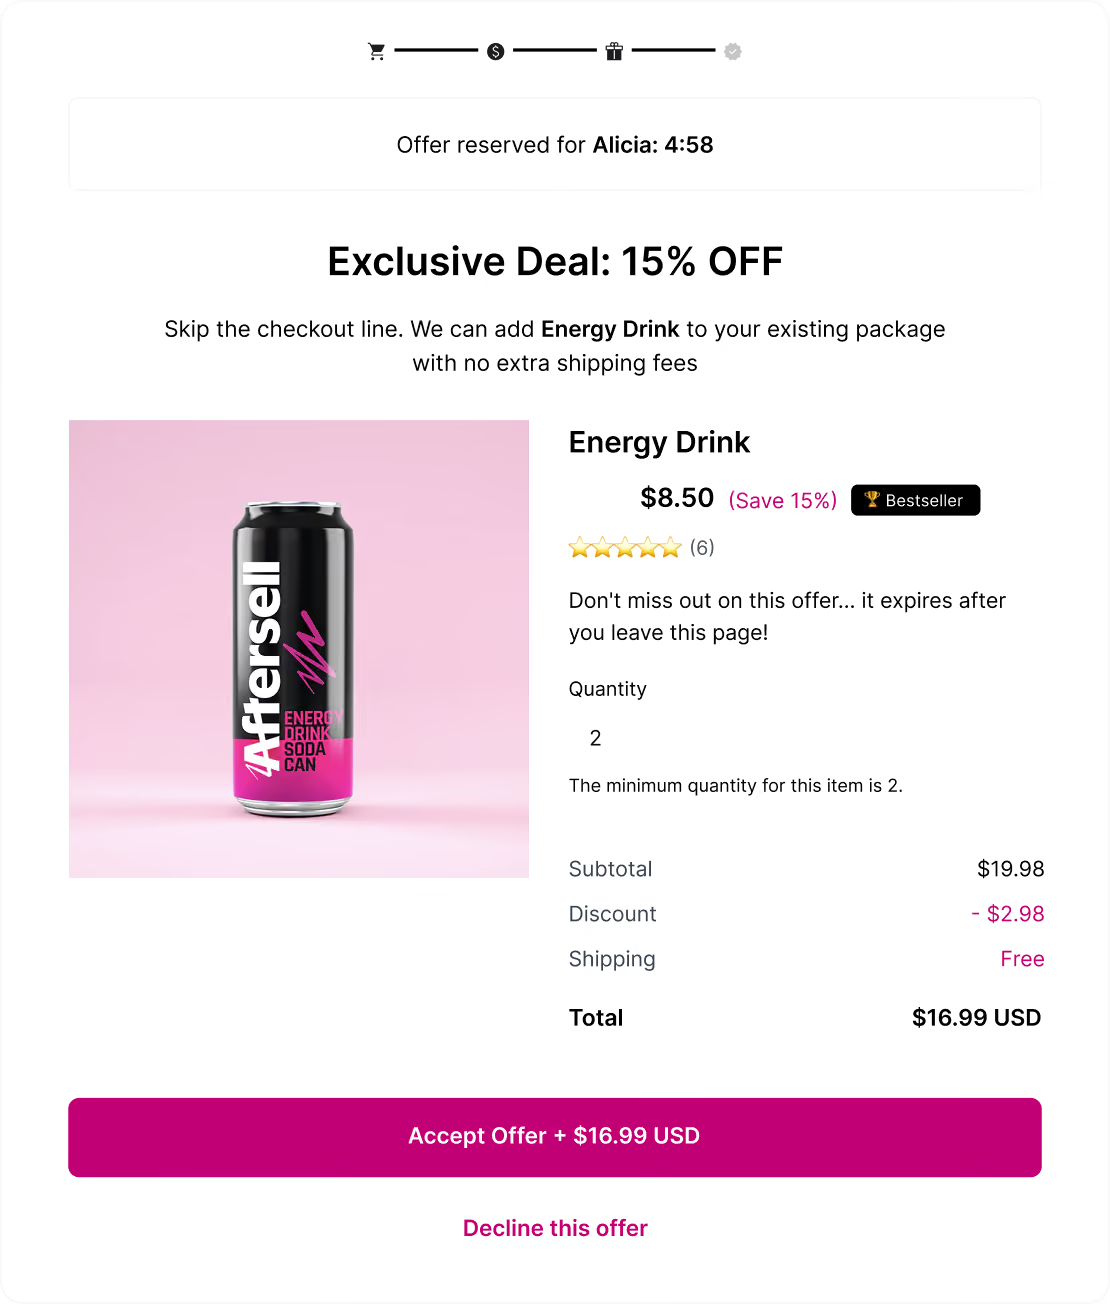


Chapter 3: Thank you page
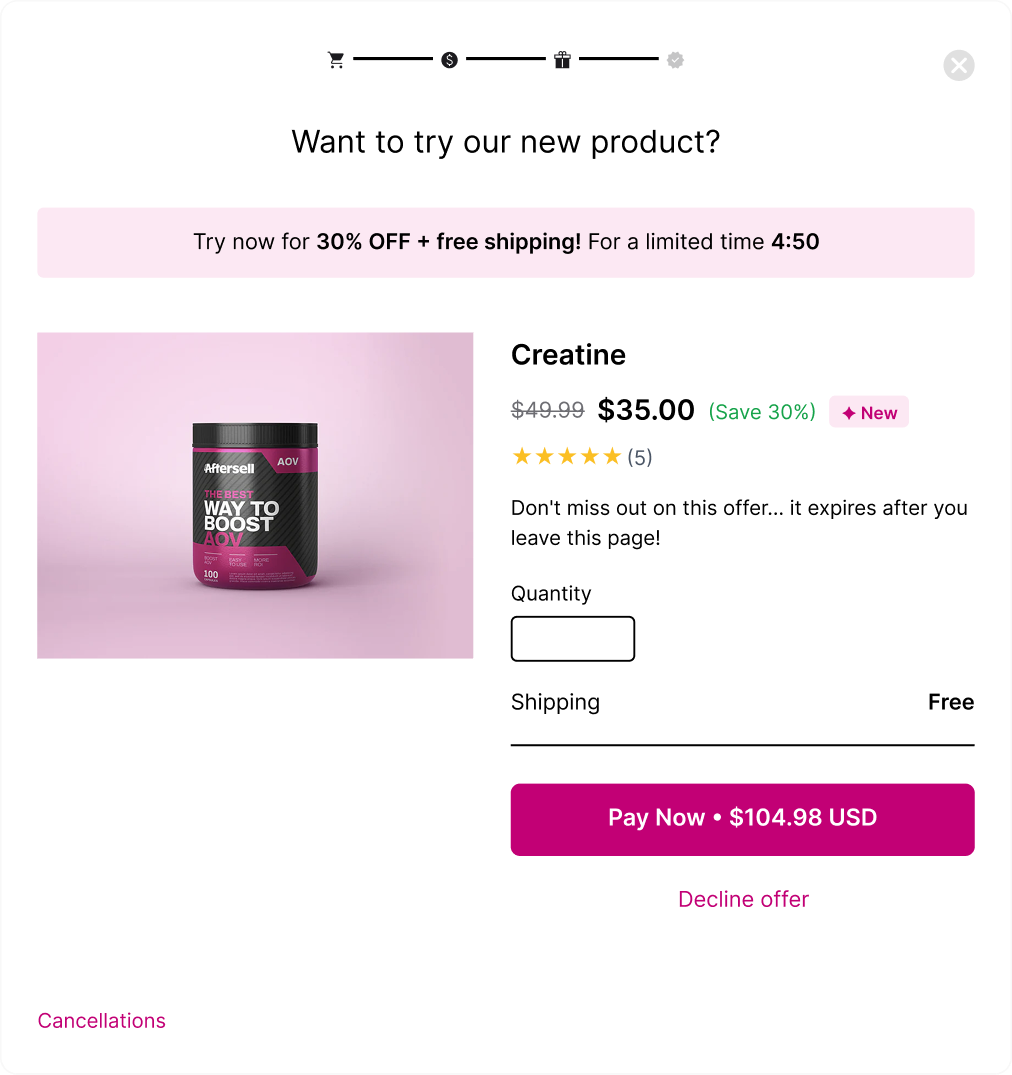
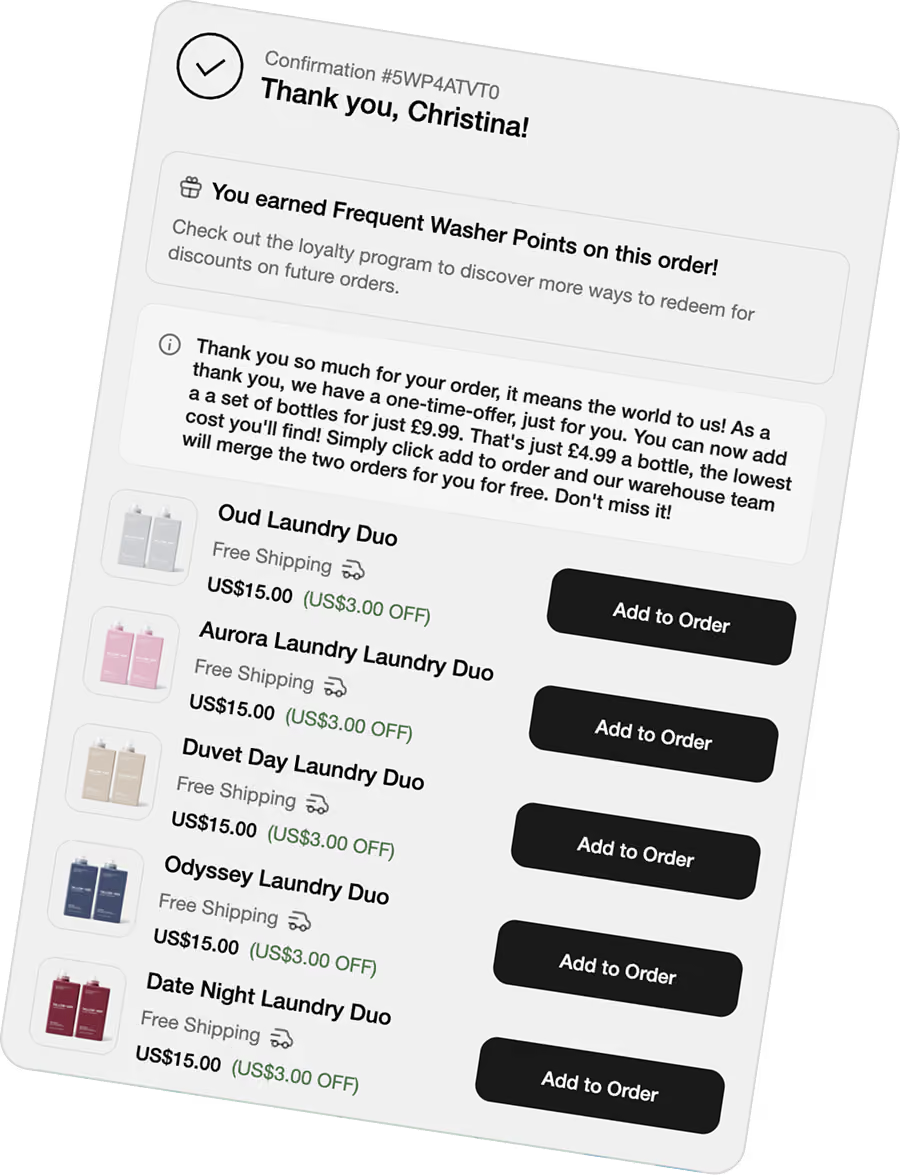
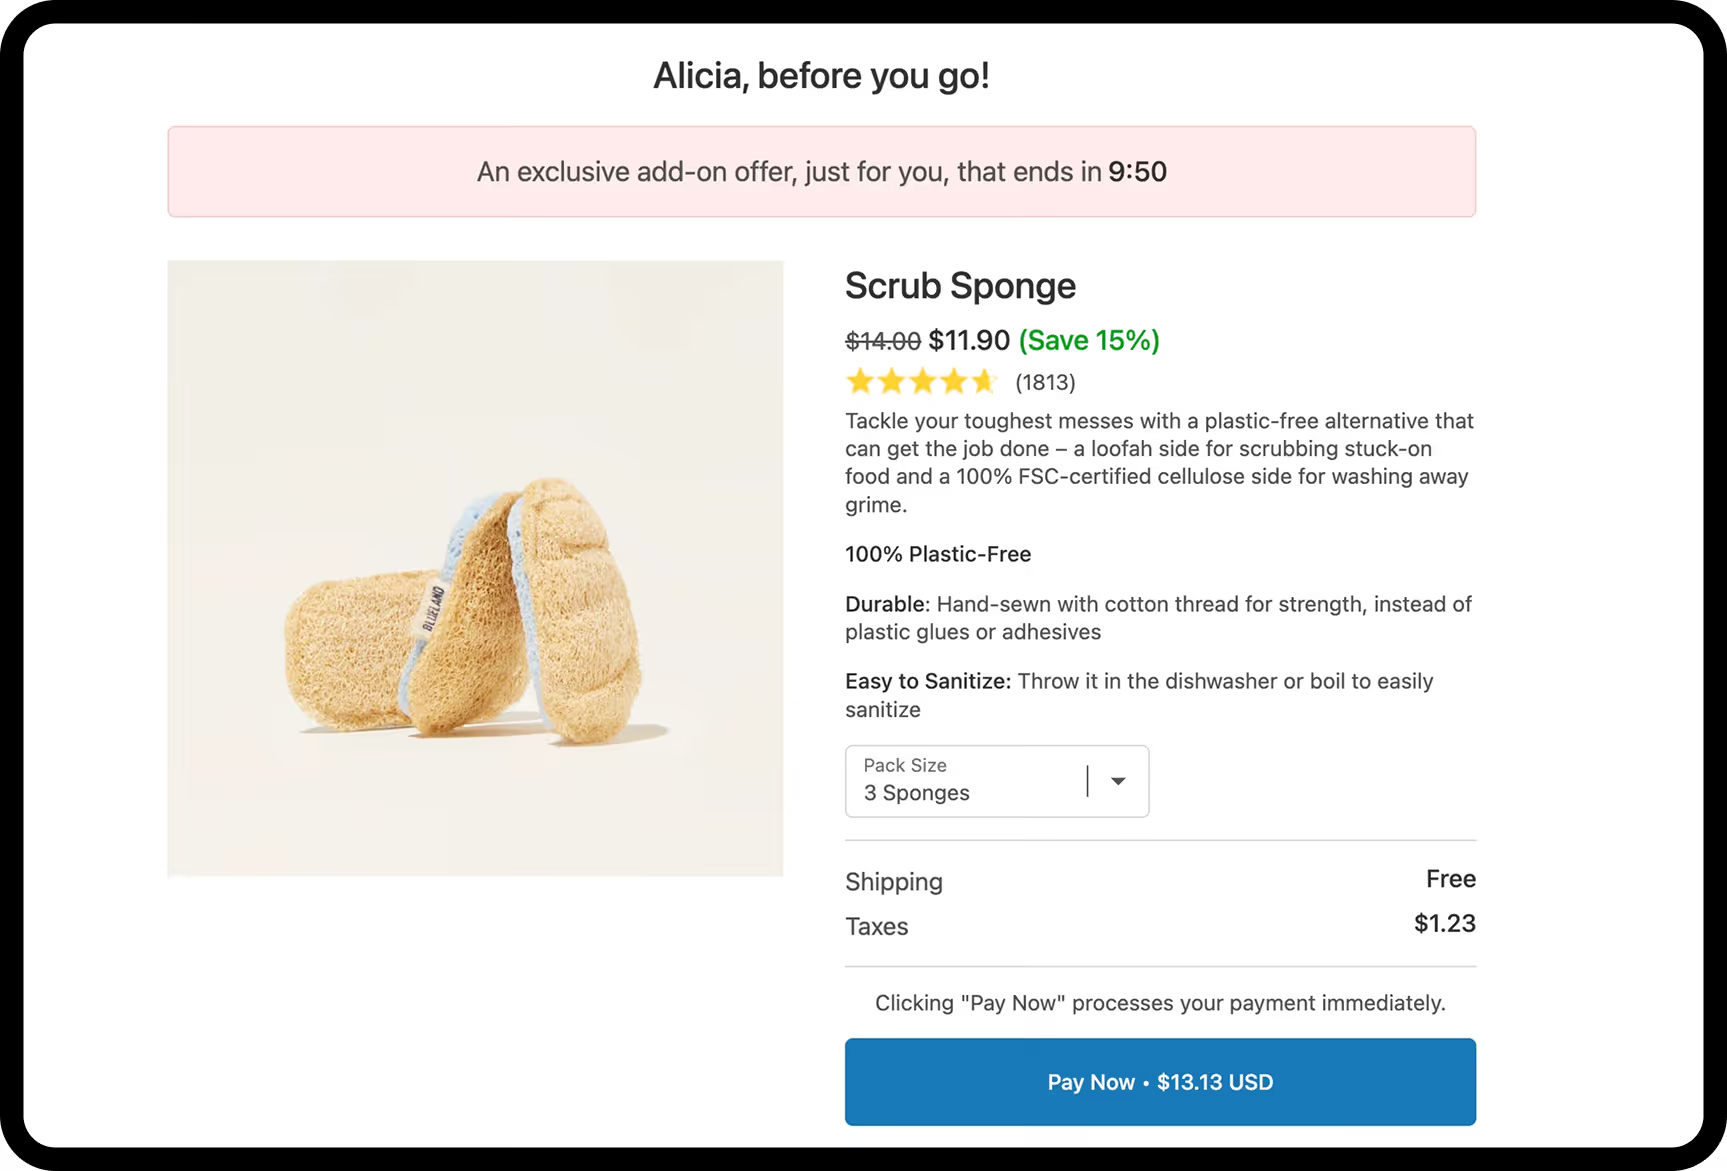
Merchants who activate Thank You Page (TYP) monetisation alongside post-purchase upsells (PPU) generate significantly more total revenue.
The data shows this across two distinct effects.
Stream 1
First-party upsell offers
Product recommendations and cross-sells shown after order confirmation. Revenue goes directly to you.
Works best for complementary products, refills, accessories, and loyalty offers.


Stream 2
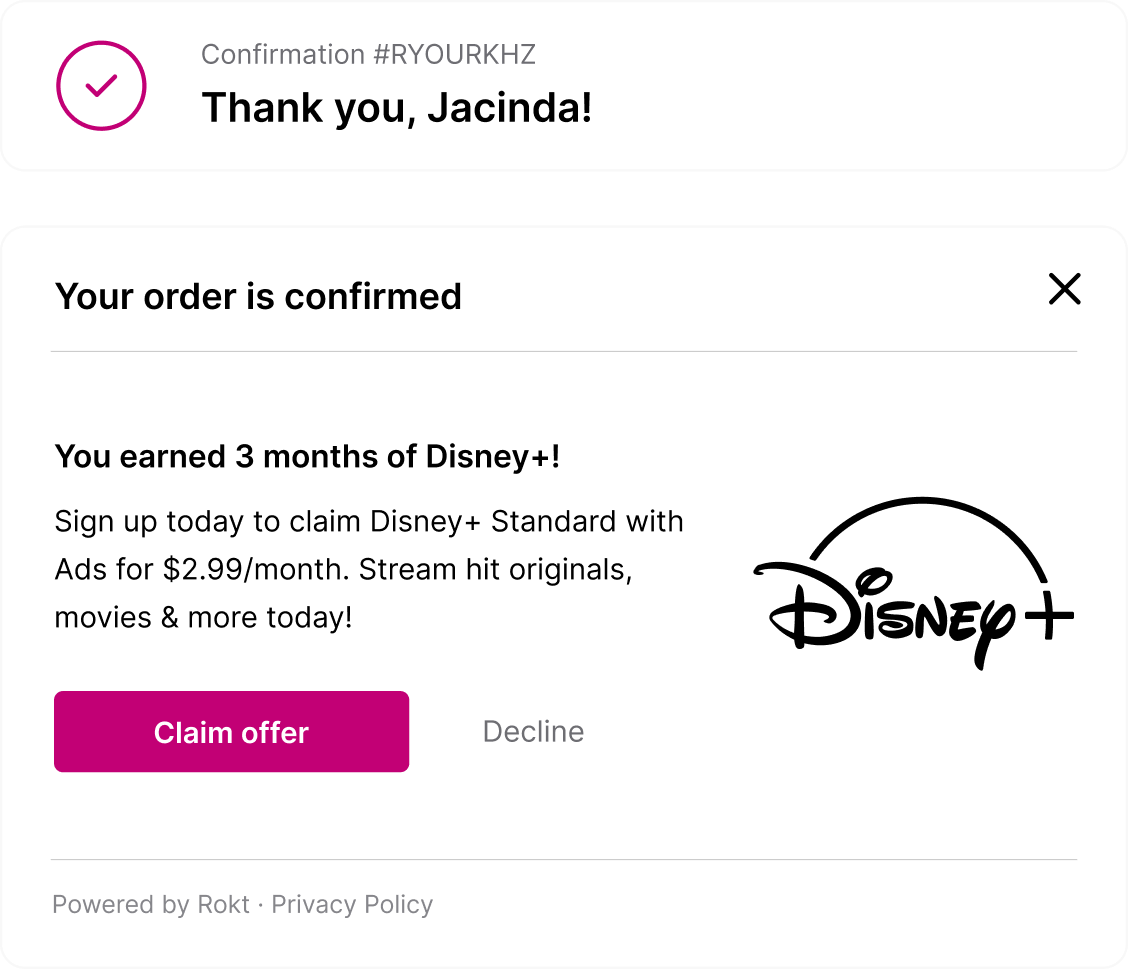
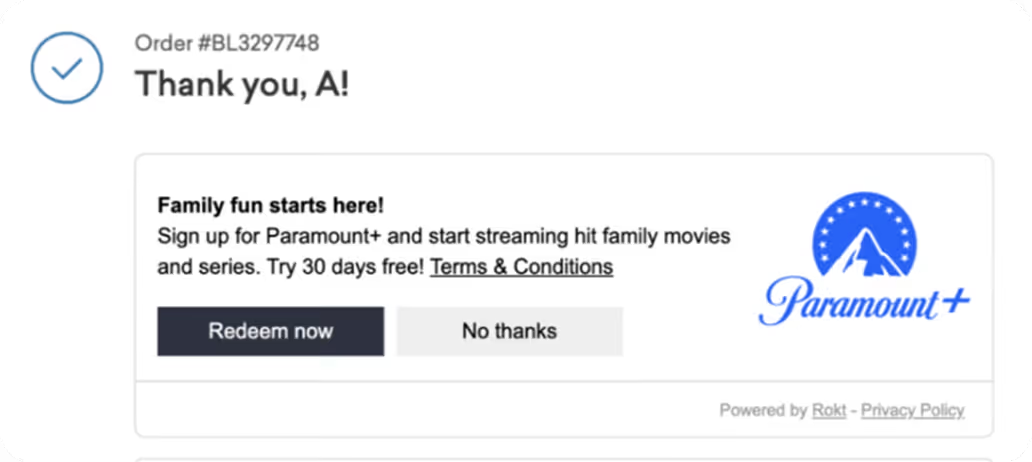
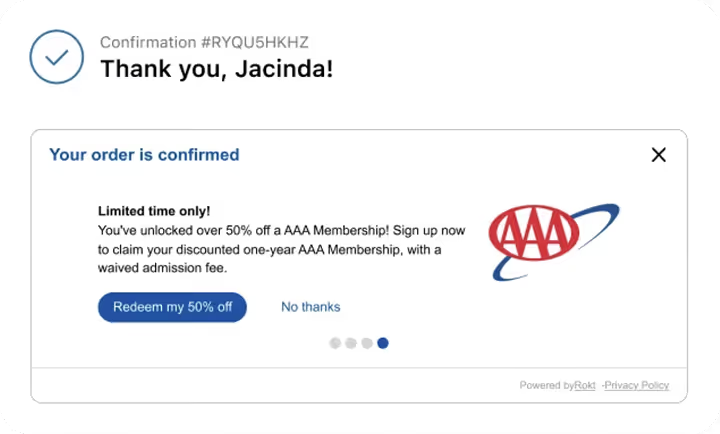
Rokt Thanks offers
Premium offers from 1,000+ vetted national brands that are matched to each customer automatically via AI. You earn per transaction. Zero ongoing management once live.


Finding 01
Adding the Thank You Page Doesn’t Split Revenue.
It Multiplies It.
Merchants who activate Thank You Page monetization alongside post-purchase upsells generate significantly more total revenue.
Typical users see about an
103% Increase
in post-purchase revenue from the same traffic
Adding the Thank You Page upsell does not reduce performance. It is associated with stronger performance across the entire system.
Merchants running both surfaces are not just adding another revenue stream. They are operating a more complete post-purchase system.
The increase in PPU performance suggests that these merchants are not simply adding features. They are maintaining higher overall funnel quality.

Finding 02
Adding all Three Streams Multiplies Revenue Without Competing
Rokt Thanks revenue introduces an additional monetization layer on the confirmation page. At scale, this translates into meaningful revenue.
First-party upsells require a customer to make an additional purchase decision.
Brand partnerships monetize attention differently. The customer engages with a relevant external offer, and revenue is generated per interaction rather than per product sold.
Because these behaviors are different, they do not compete. This is why the data shows no meaningful drop in upsell performance when brand partnerships are active.
The two streams operate in parallel, capturing different types of engagement from the same session.
[ Your Brand ]
+




=

$300K in incremental profit for every 1M transactions

Rokt Thanks has been an easy win for post-purchase. The biggest surprise was how incremental the revenue was — customers had already completed checkout, so the offers didn’t create friction or hurt conversion rates.

John Peters
Amberjack
Finding 03
Industry Influences Performance, but It Doesn’t Define It


Pets
or


Health &
Wellness
Health & wellness brands and pet brands perform well with confirmation page offers. But industry does not determine performance on its own.
Because at the same time, the largest differences in total revenue are not explained by industry at all.
Industry influences how customers behave, but it does not determine performance on the confirmation page.
Every vertical in the dataset contains both low-performing and high-performing merchants.
The defining difference is not what is being sold. It is how the page is built and how it connects to the rest of the post-purchase system.
Merchants running a single surface, with a default setup, consistently underperform regardless of category.
Merchants activating multiple surfaces and configuring them intentionally outperform across every vertical.
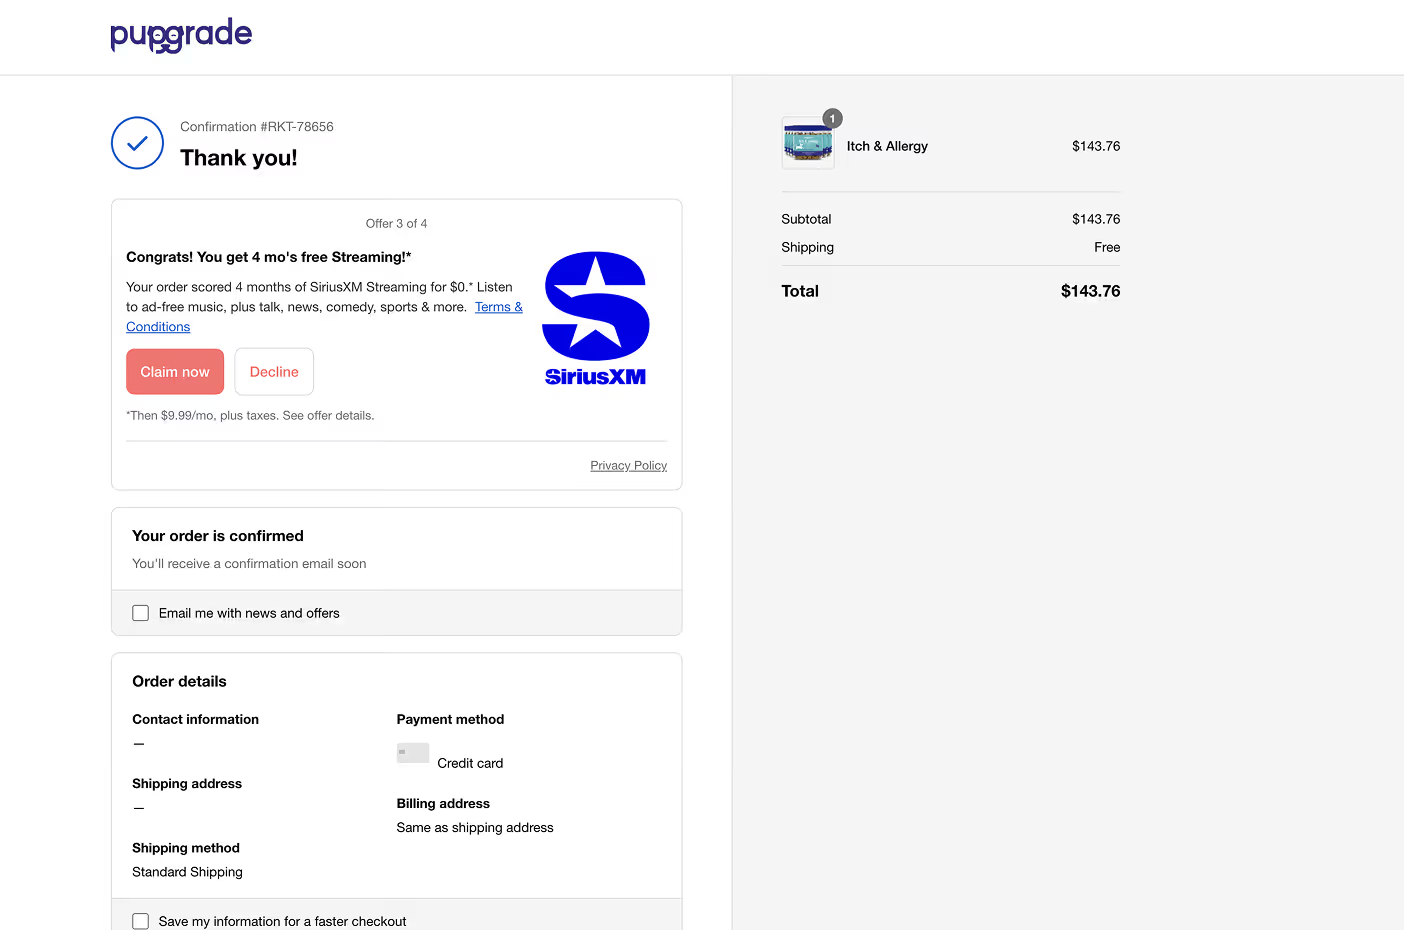


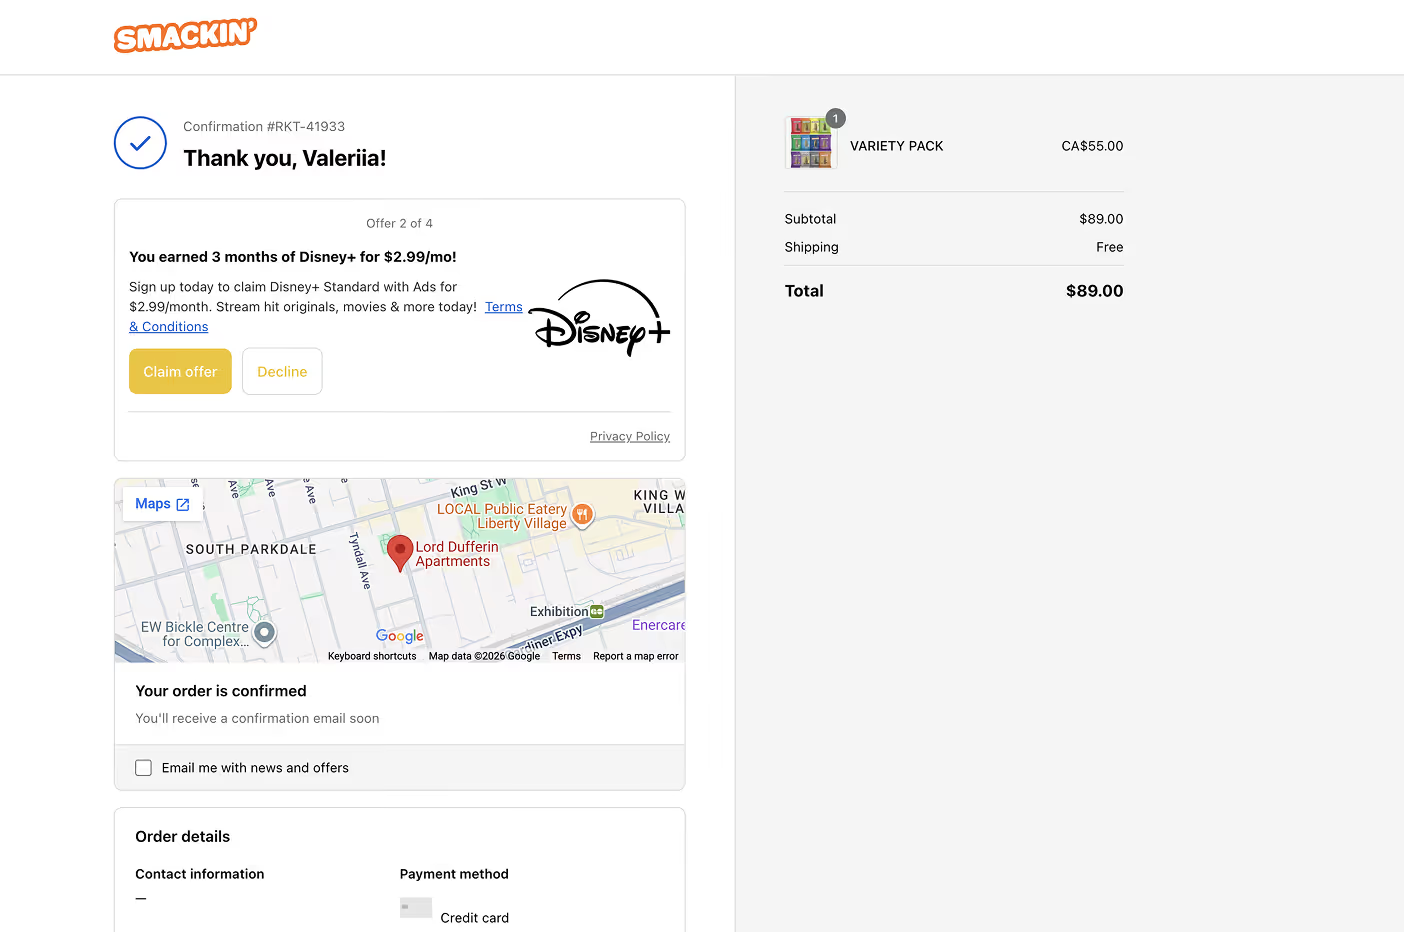


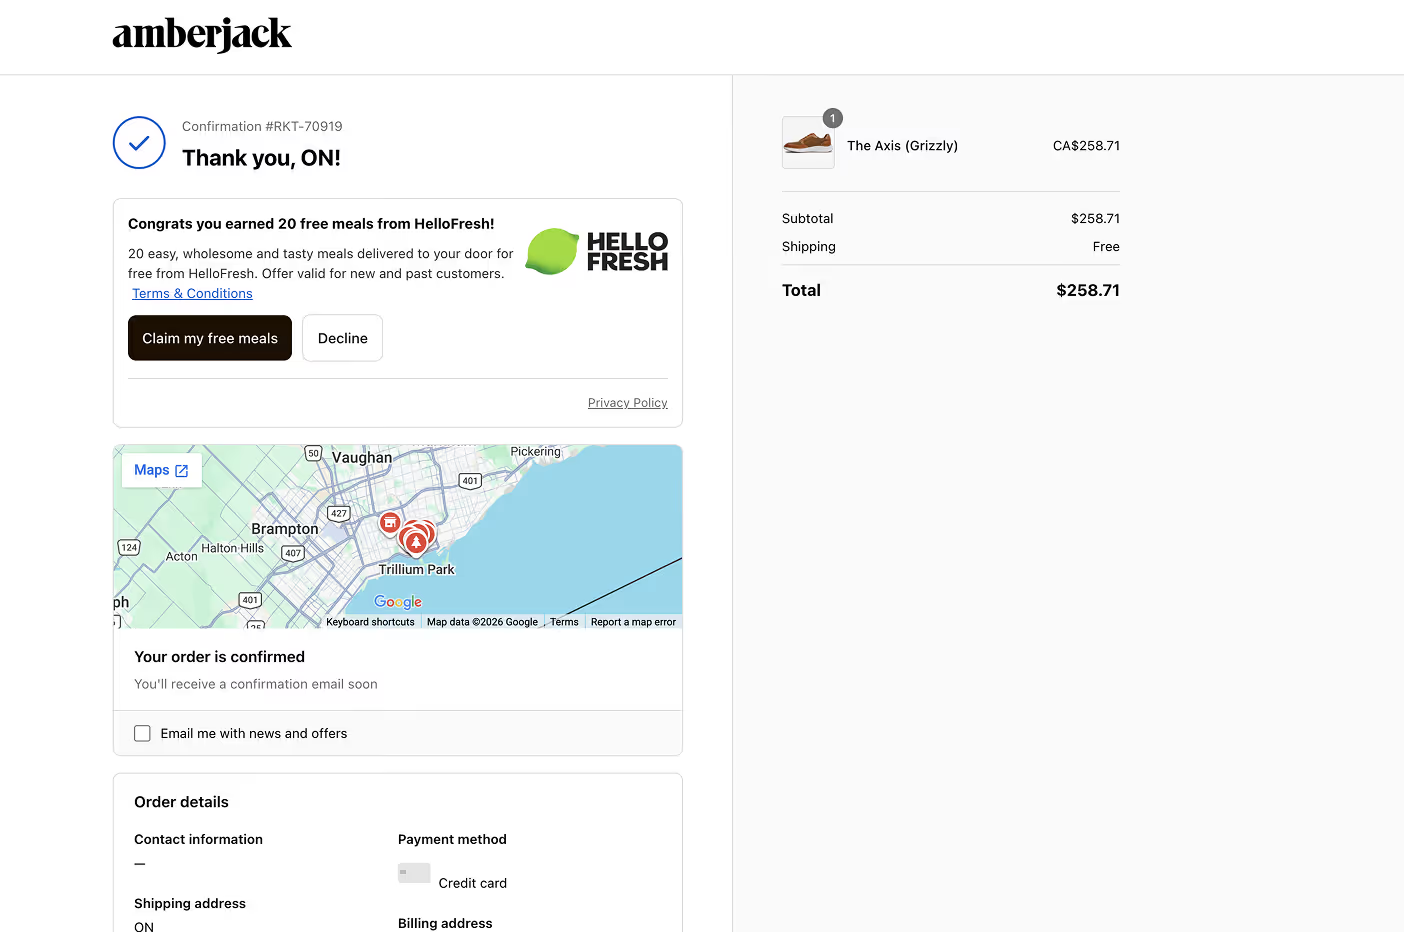

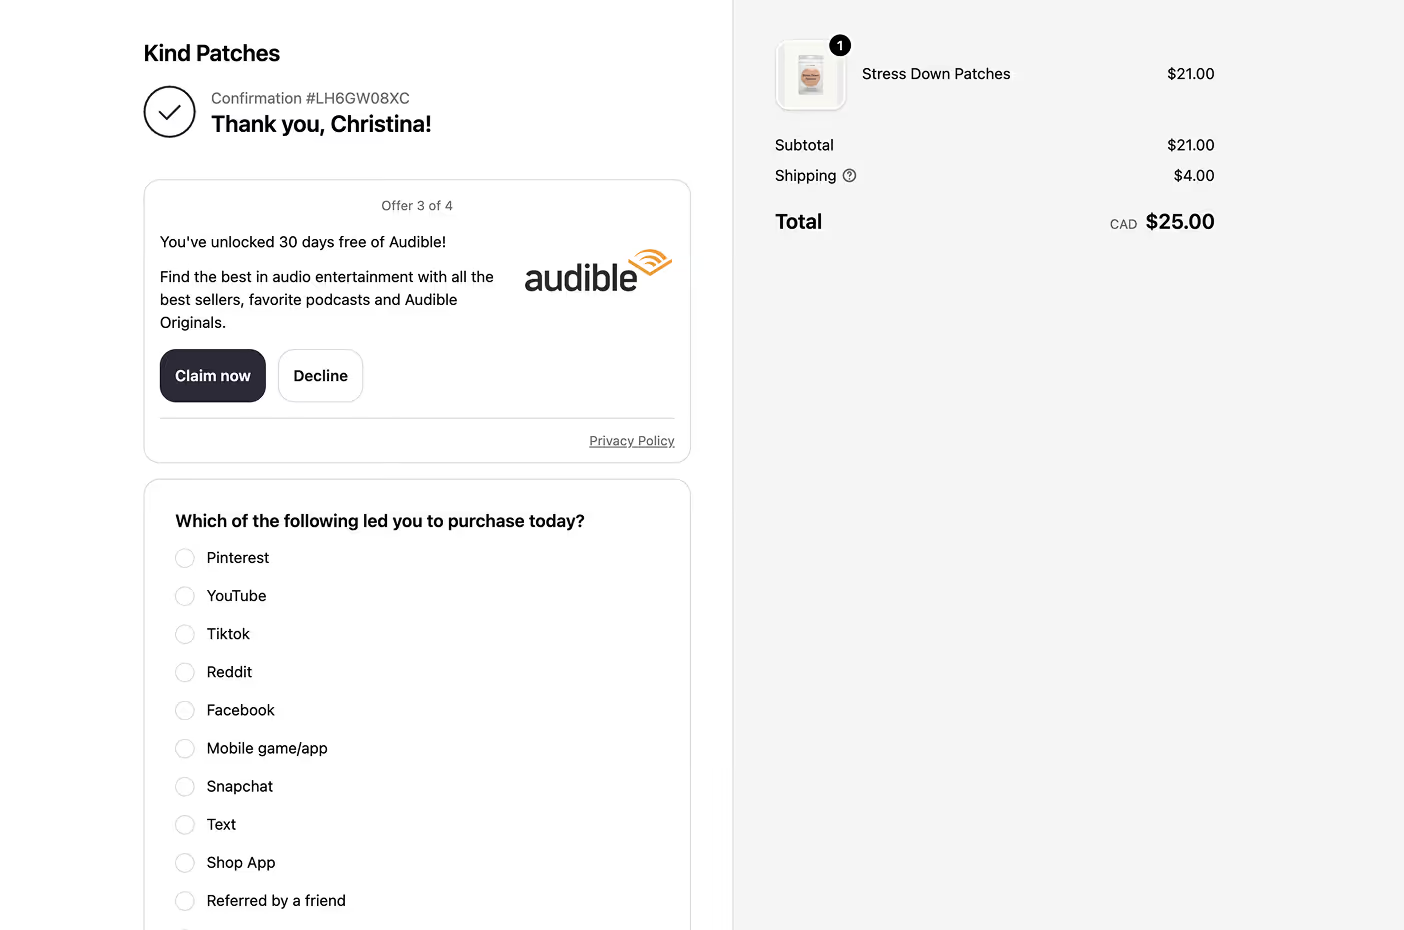


Finding 04: Data from

If You’re Just Saying Thanks
on the Thank-You Page,
You’re Missing the Moment
1 in 4
Buyers actively engage with thank-you page survey content after purchase
35.8%
Top-quartile brands reaching
What makes that window even more valuable is who is in it.
The top three reasons?

Christmas gifts

Birthday gifts

General gifts
01
02
03
Finding 05: Data from

Upsells Can be Applied from Post-Purchase to Portal
Post-purchase isn’t siloed to the cart, checkout, or thank you page alone.
For subscription brands, one of the highest-intent post-purchase moments is right in the customer portal (where a subscriber logs in to manage their subscription).
That's where Feals, a premium CBD wellness
brand, found a major upsell opportunity.
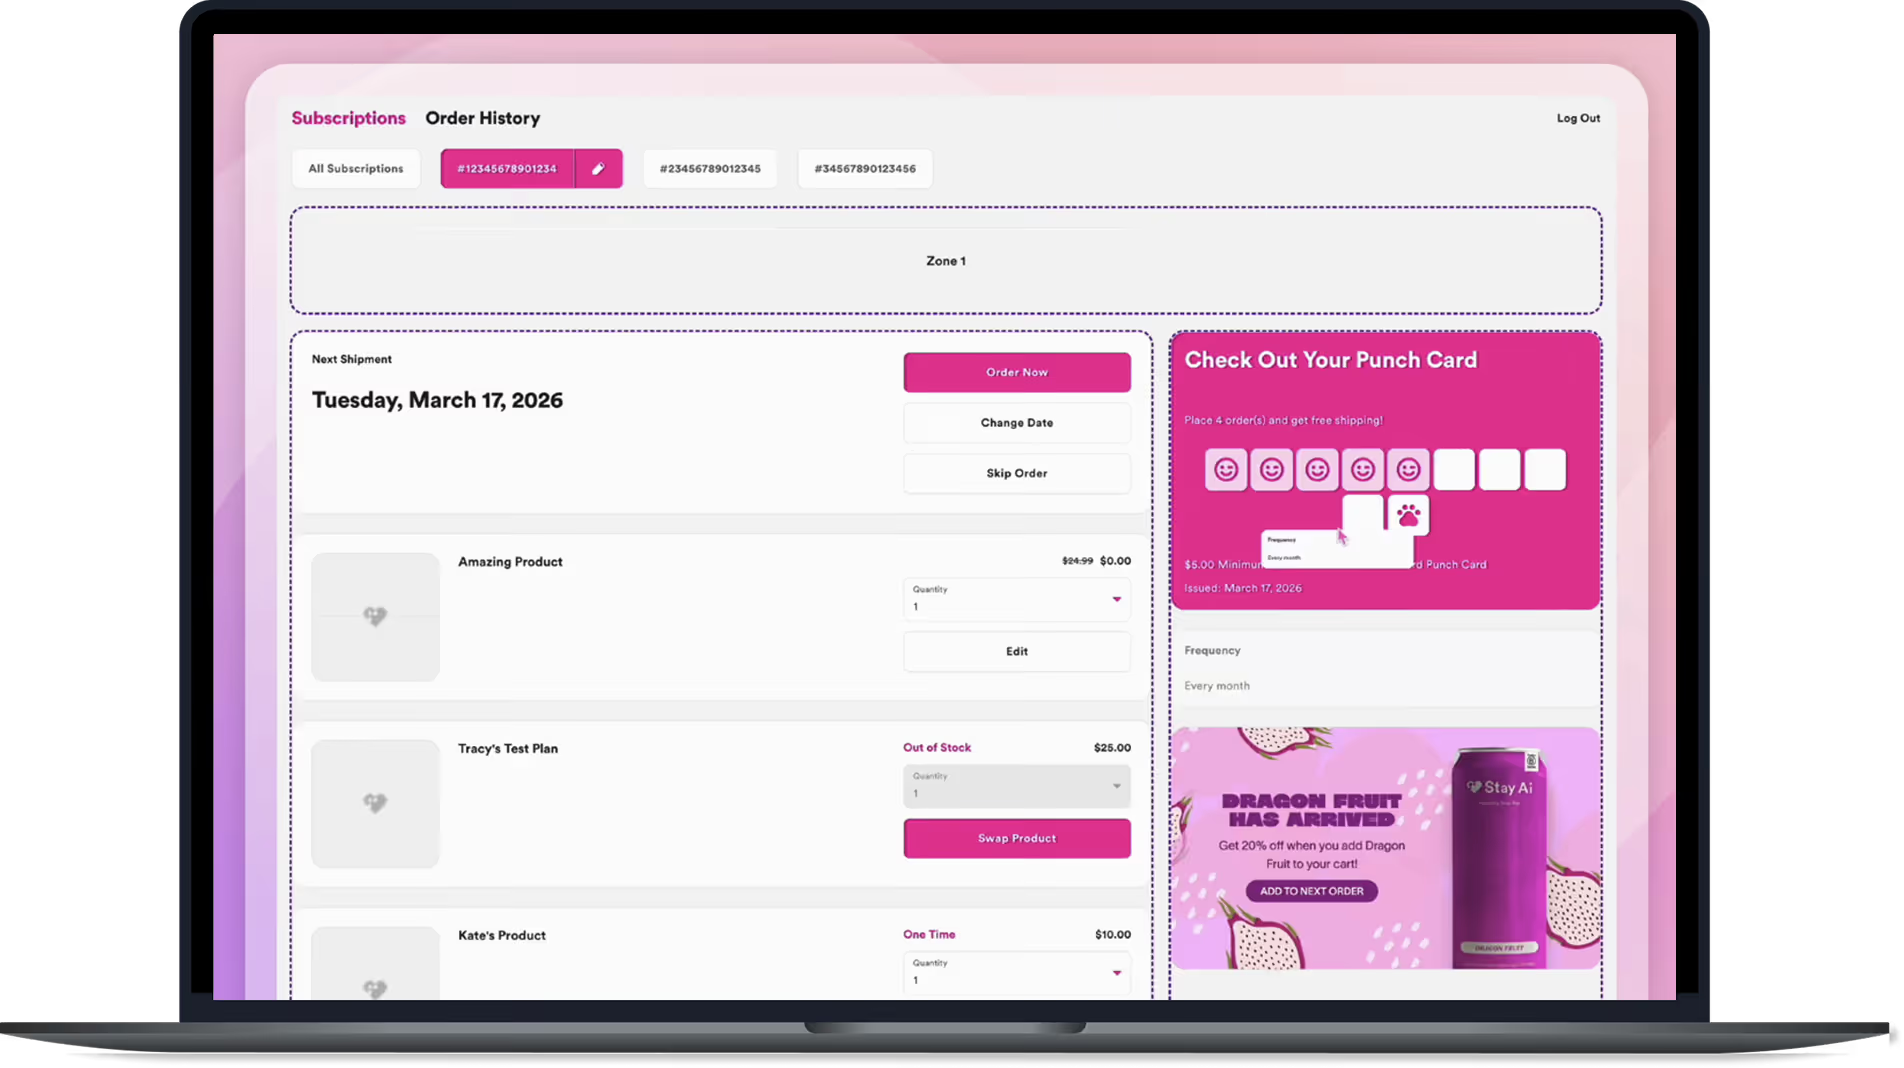
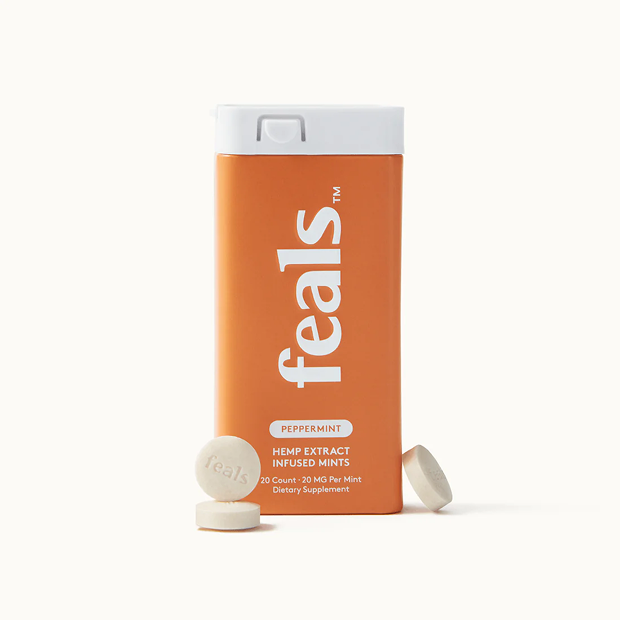
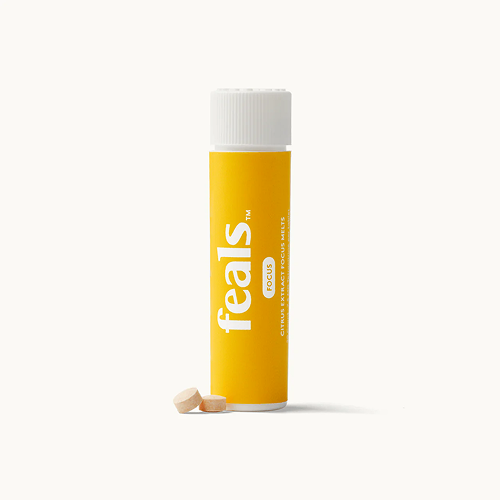
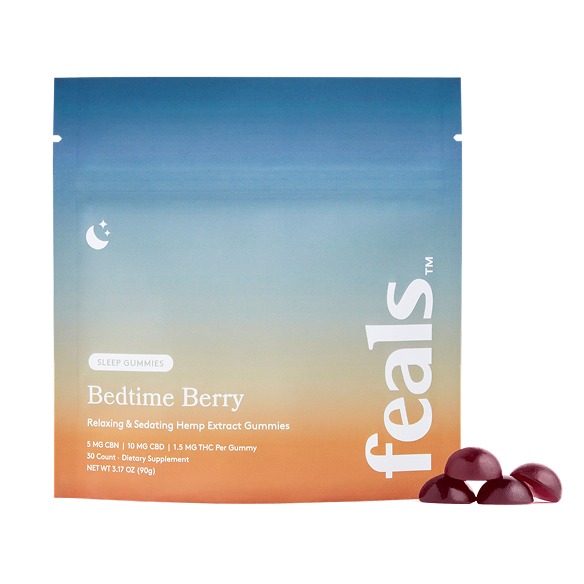
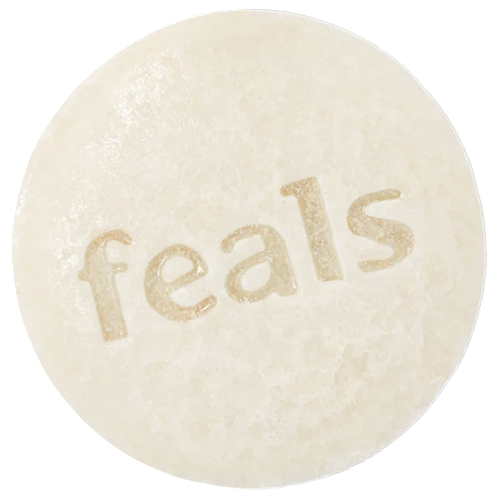
“When Feals launched their new Green Apple gummy flavor, they gave subscribers exclusive early access through a shoppable banner within the customer portal. Subscribers could add the new flavor as a one-time add-on with a discount, all in a single click."

Grace Nicklas
Ecosystem manager, Stay AI




Over the two months the flavor was featured in the portal, and Feals saw:
+458%
Increase in Add-on revenue
+316%
Add-ons directly attributable to the portal banner were up

+26%
Subscription reactivations rose in the first two weeks of launch
What Top-Performing Brands Do Differently
The gap between baseline merchants and top performers is not explained by traffic, industry, or product mix. It comes from how intentionally the confirmation page is configured and how well it works with the rest of the post-purchase funnel.
01
02
03
04
05
06
07
08
Pattern 01
They build the page as part of a system, not a standalone surface
Top-performing brands understand that:
- Post-purchase upsells capture active buying intent
- The confirmation page captures both active and passive engagement
- Brand partnerships capture attention that would otherwise go unmonetized
These are not overlapping behaviors. They are complementary.
Pattern 02
They activate and correctly position multiple revenue streams
Placement plays a measurable role in performance.
Kind Patches, for example, moved its brand partnership placement above the fold on the confirmation page, resulting in an 18% increase in average transaction value. This is a strong signal that visibility directly impacts engagement and downstream revenue.
Pattern 03
They activate multiple revenue streams instead of relying on one
Top-performing brands activate all available layers:
- post-purchase upsells
- confirmation page upsells
- brand partnerships
Each layer targets a different action:
- making another purchase
- considering an additional offer
- engaging with a relevant external brand
Because these behaviors are different, they do not compete.
Pattern 04
They allow the system to optimize, instead of restricting it
Rather than manually curating or limiting which offers appear, they allow the system to learn from real customer behavior and optimize over time.Rokt Brain continuously analyzes:
- which offers customers engage with
- which offers they ignore
- which patterns correlate with conversion across similar customer profiles
And uses that data to match the best offer to each individual customer.Merchants who allow Rokt Brain to fully optimize see more consistent performance over time, rather than the drop-off that occurs with static or manually controlled setups.
Pattern 05
They optimize for total revenue, not individual metrics
Top-performing brands are willing to:
- accept lower conversion on individual offers
- introduce additional layers of monetization
- test different configurations
As long as total revenue per visitor increases.
Pattern 06
They activate early and allow performance to compound
Matching engines learn from customer behavior. A/B tests refine offers. Performance improves with volume and iteration.
Top-performing brands do not delay activation waiting for a “perfect” setup.
They activate early, then optimize.
Pattern 07
Segment your upsell by purchase intent
If you're asking "who is this for?" on your thank-you page, use the answer. Gift buyers should see gift-adjacent upsells, like bundles, add-ons, or gift wrap.
“Ensure your offers are aligned with holidays, like Mother’s Day, Valentine’s Day, or the Q4 holiday rush for extra buy-in.”
- Allie Mistakidis, Content Writer at Triple Whale
Pattern 08
Give subscribers early access to new launches
Exclusivity drives action. When you launch a new product, let subscribers be the first to try it, before it's available anywhere else. You can do this by segmenting your offers in Aftersell to a specific type of buyer (repeat, subscriber, etc) to show an exclusive product. Or as Stay AI suggests, leverage your customer subscriber portal to highlight shoppable banners and one-click add-ons to surface new products, bundles, or limited-time offers.
CH.
04
Cart
CH.
04
Cart
CH.
04
Cart
CH.
04
Cart
Chapter 4: Cart
The cart is the Highest-Intent Moment Before Checkout.
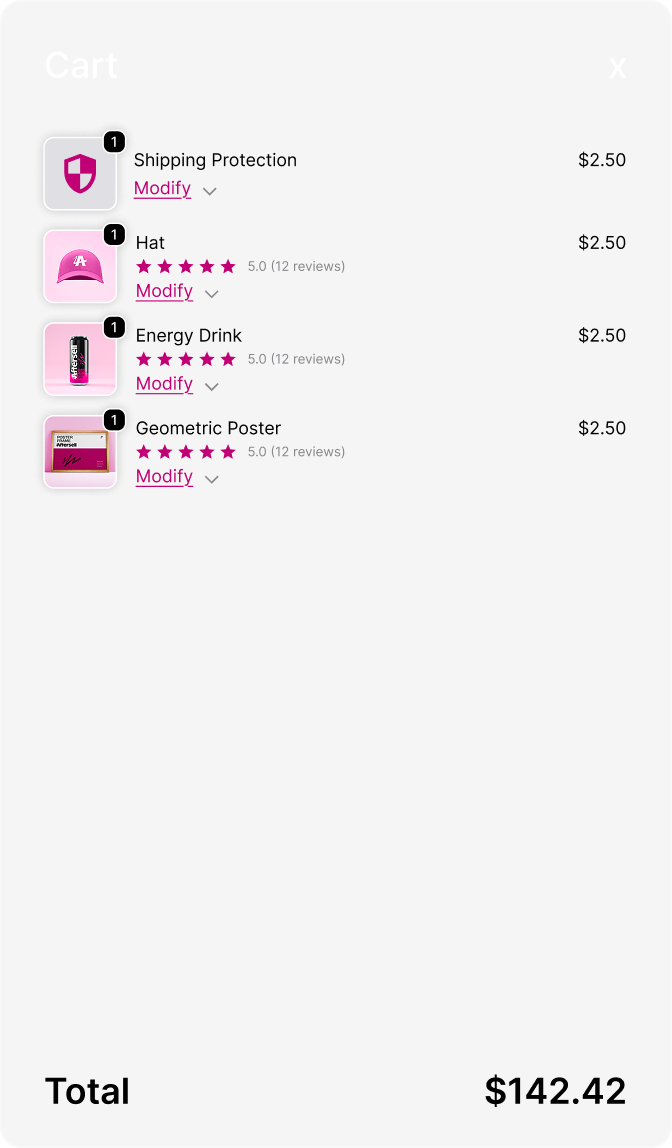
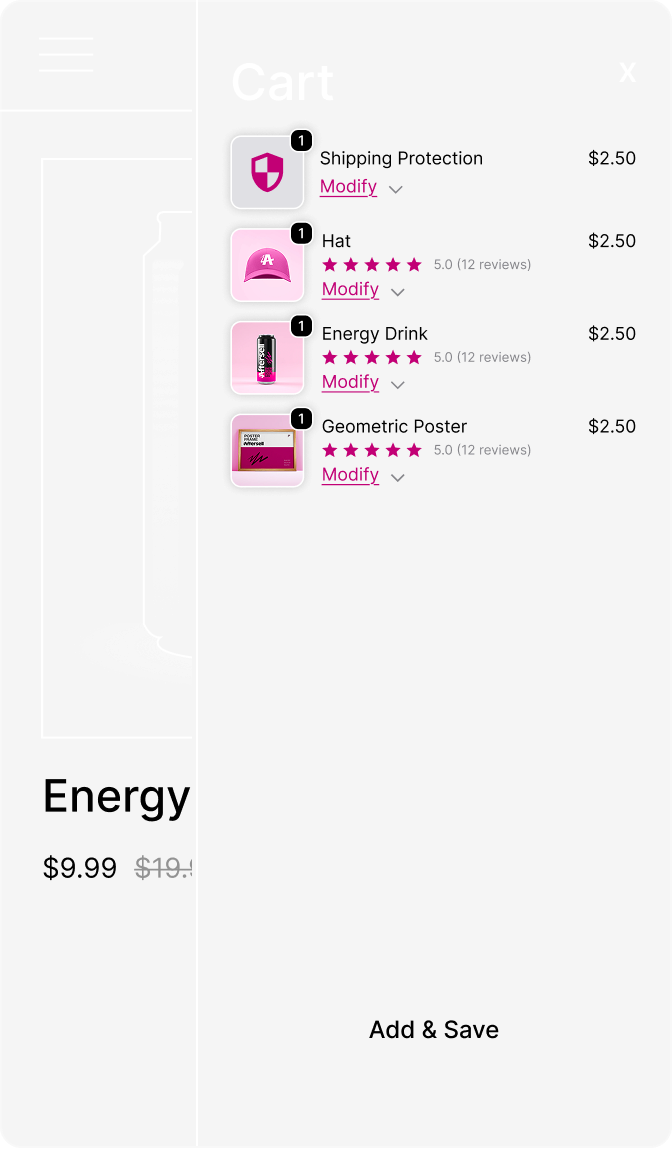
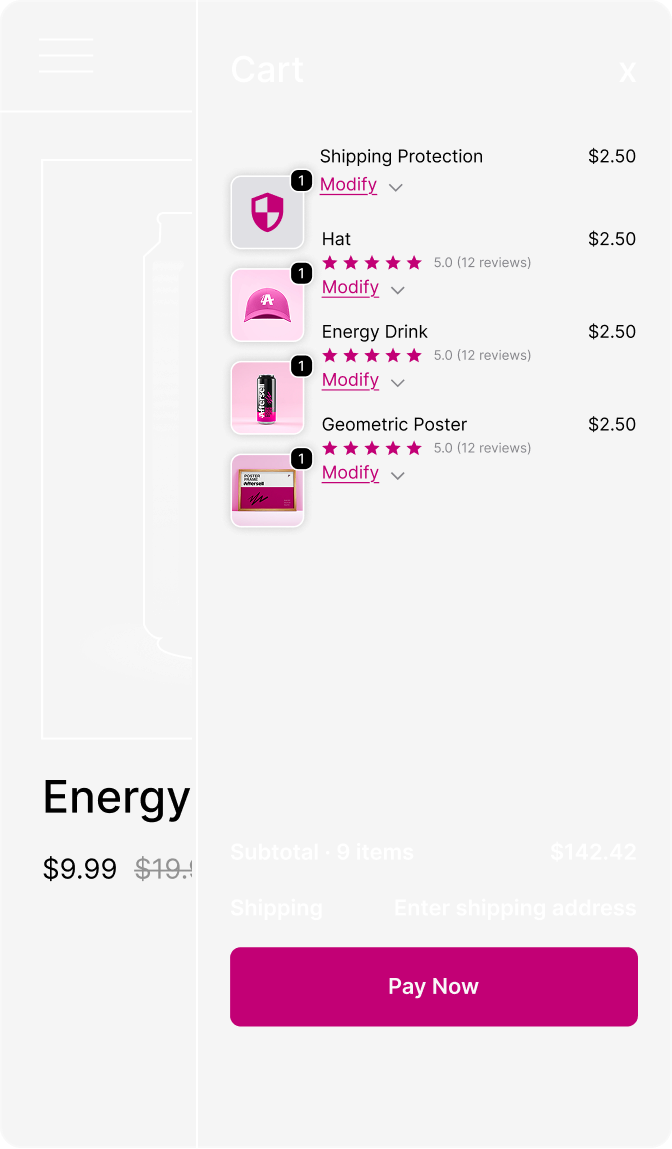
Across nearly 50 million cart sessions, the data shows something most brands miss: the cart is not a passive holding space. It is an active conversion surface. The difference between brands that treat it that way and those that don't shows up directly in revenue.
Most brands install a cart and leave the configuration at default. They are capturing a fraction of what the surface can generate.
Finding 01
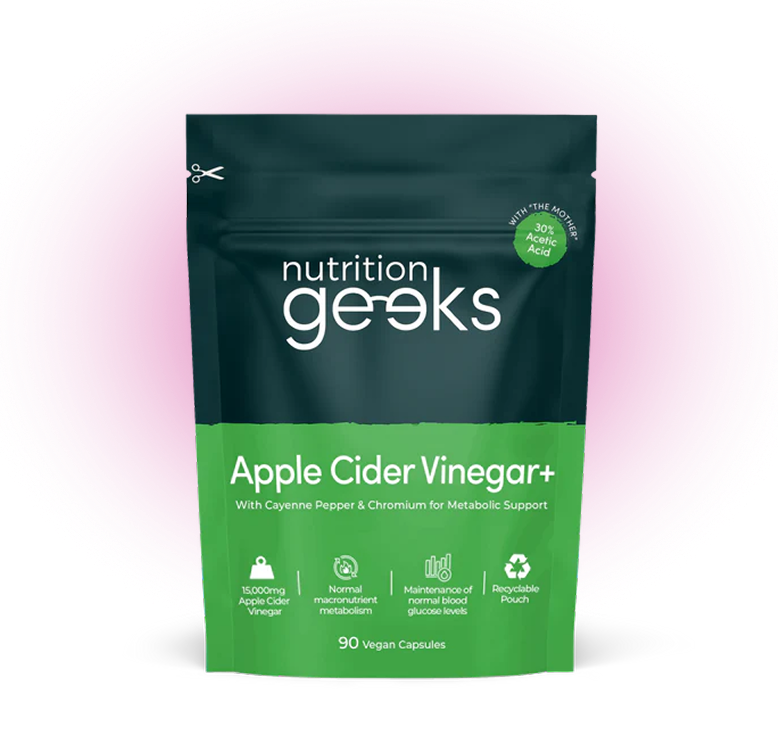
The Cart Generates 4×
More Revenue Per Session than Checkout

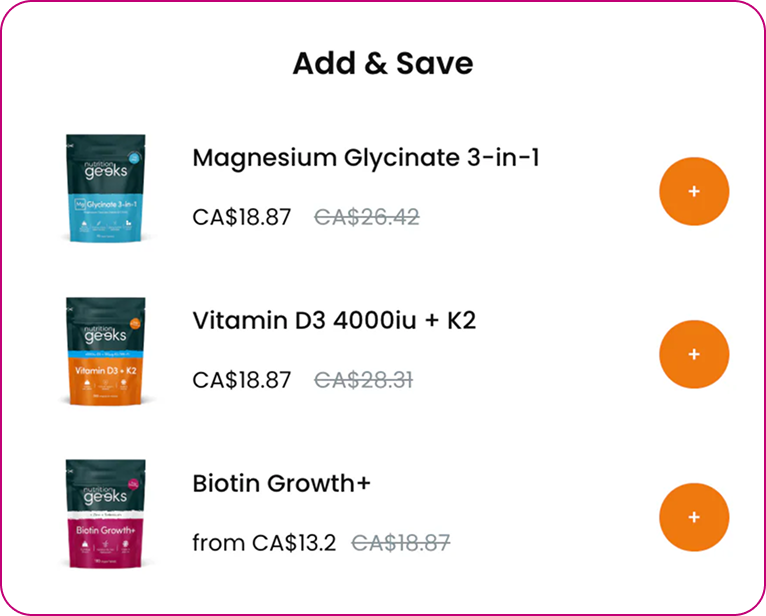
The explanation is in customer psychology, not product selection.
In the cart, the customer is still in consideration mode. They are reviewing what they have, and the mental frame has not yet shifted to "finish this transaction."
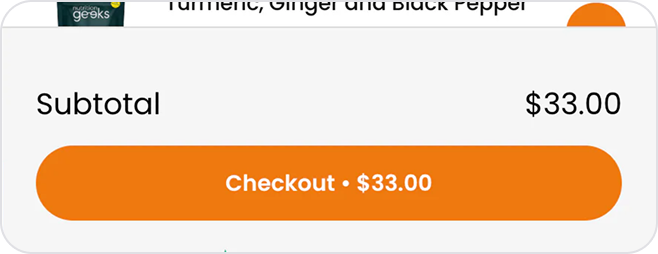
An upsell in the cart drawer feels like a natural extension of the browsing decision — not an interruption of the payment process.

.png)

Finding 02
Most Merchants Pick the Wrong Cart Modules to Focus on.
The reason mirrors a pattern seen in checkout: decision friction determines conversion more than product selection.
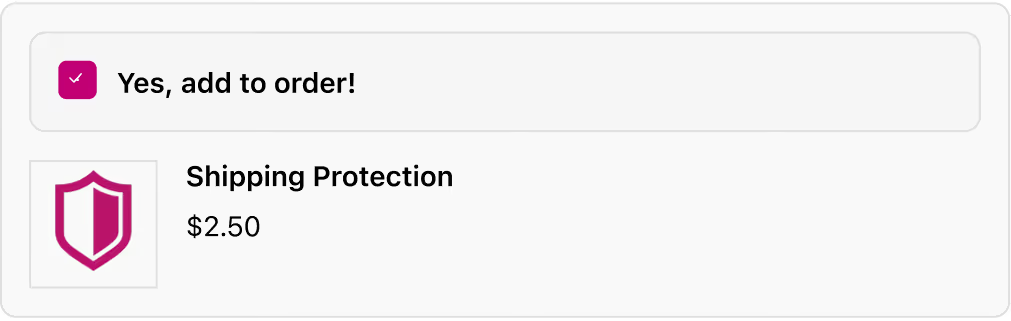
Add-ons are presented as a toggle, not a purchase. The customer is opting in to something that is already framed as part of their order (shipping protection, a small complementary item, an optional service).
The action requires less deliberate choice than a standard "add to cart" decision.



Finding 03
Module Stacking Has a Compounding Effect on Conversion
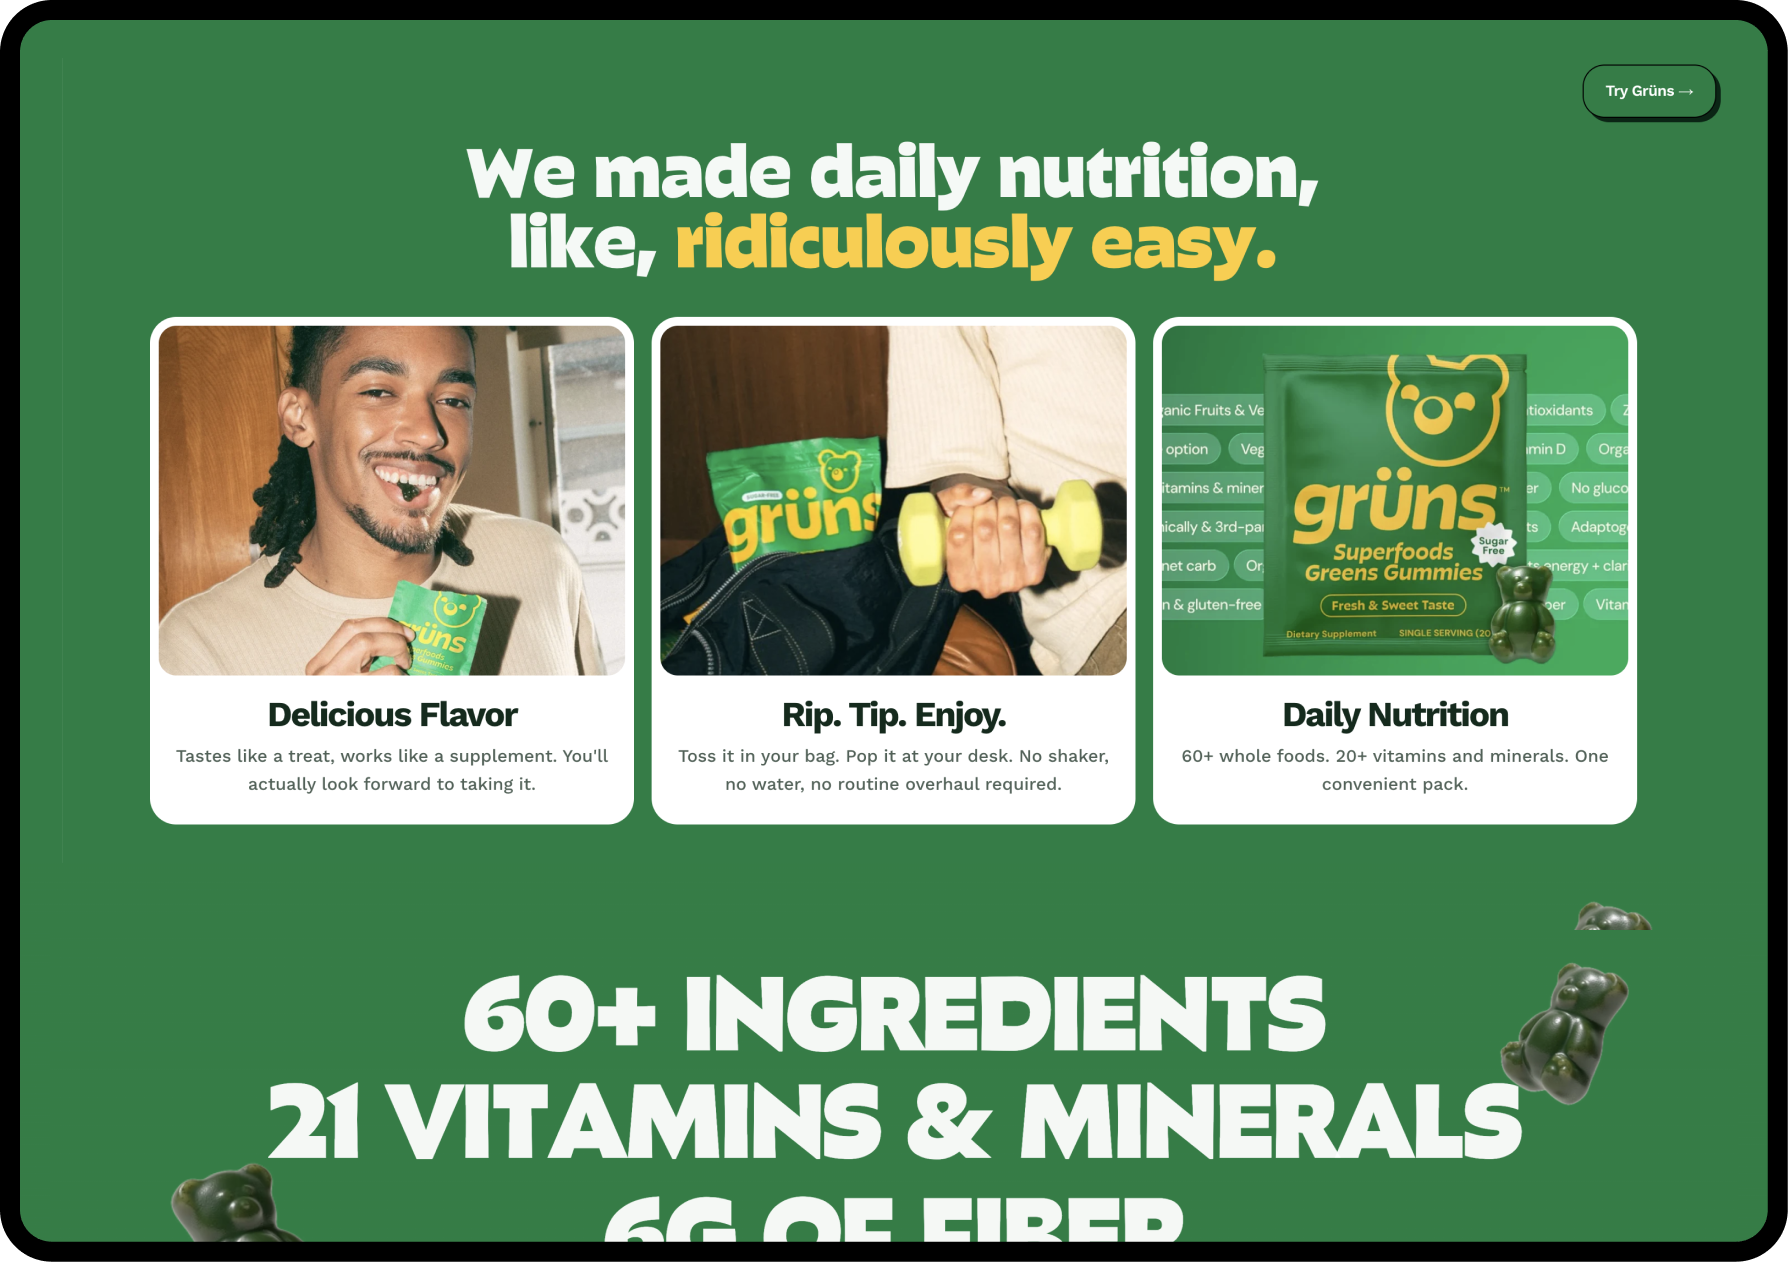
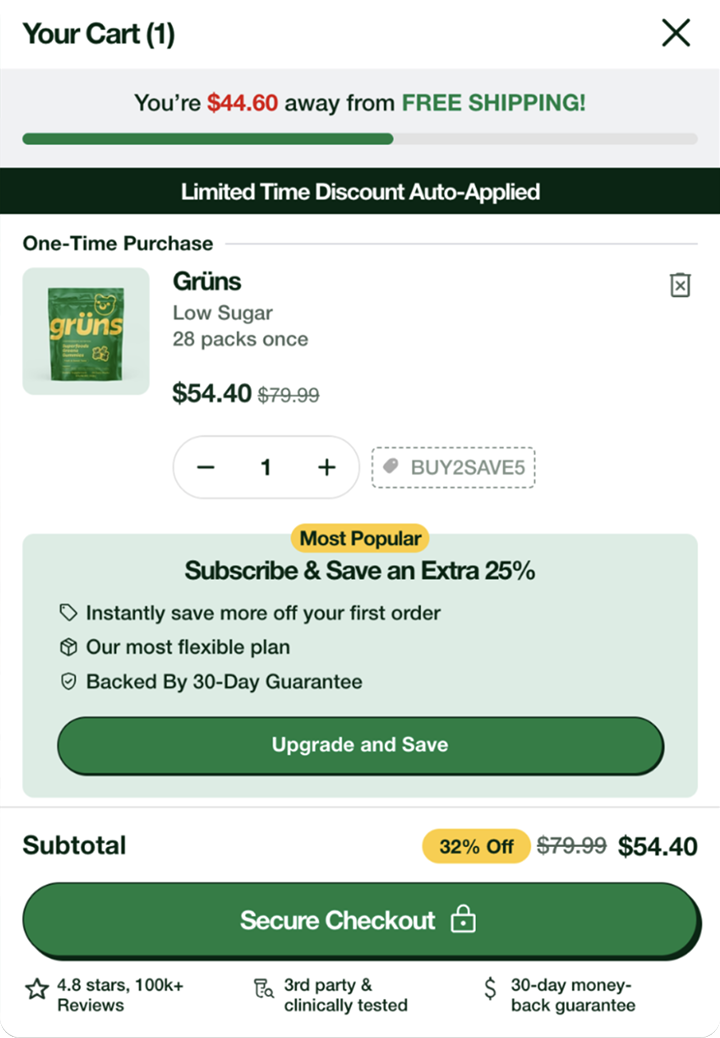




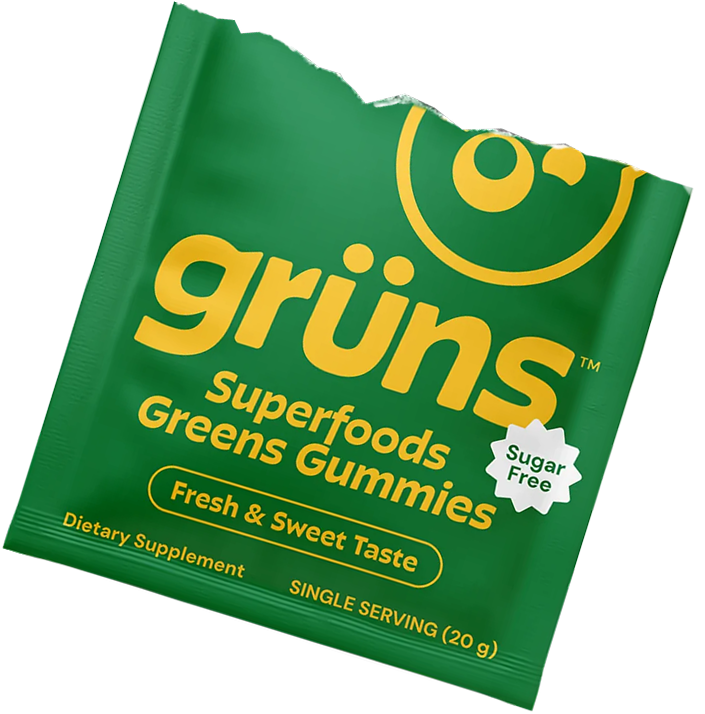

Always be testing is the way we think about content and cart. It’s such high-leverage real estate on the site, we can never ignore it. What’s the most important thing for us to show the customer after they’ve added a product to cart? That’s how we think about it. Then, having checkout, post-purchase, and thank-you page upsells also means we have our bases covered. Cumulatively, our upsells are converting around 17–20% of all customers who interact with them.

Michael De Lia
eCommerce Manager, Gruns


The fastest way to apply this report is to connect it to your own data
Connect this report to Claude, Perplexity or ChatGPT and compare it with your own checkout data.
Am I underpricing my post-purchase offers based on my AOV?
Should I be adding more steps to my post-purchase funnel?
Where am I leaving revenue on the table in my current funnel?
What offers should I test next based on my product catalog?
Am I optimizing for conversion rate or total revenue? Which should I prioritize?
What would a 3-step funnel look like for my store based on this data?
What Top-Performing Brands Do Differently
Across the dataset, a small group of merchants consistently outperforms the baseline. Their results are not explained by volume or vertical. They come from a different approach to how checkout is treated as part of the funnel.
01
02
03
Pattern 01
They engage customers earlier, before intent shifts to completion
At this stage, the customer is still evaluating their order. They are open to adding, removing, and adjusting. The mindset is still centered on building value, not completing a transaction.
This is why cart upsells outperform checkout upsells on both conversion rate and average order value. The same offer presented earlier in the journey feels like a natural extension of the purchase.
Pattern 02
They build layered cart experiences, not single-module setups
They activate multiple modules that serve different purposes:
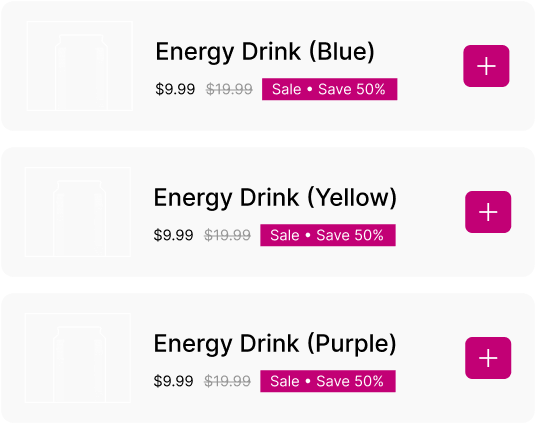
- upsells to introduce relevant products
- add-ons to capture low-friction acceptance
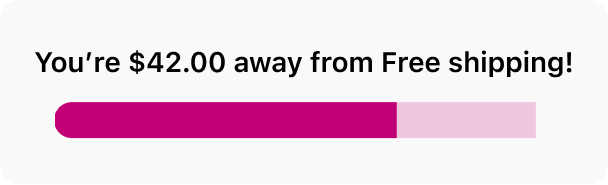
- rewards to push customers toward a higher cart value
- trust elements to reduce hesitation
Each module addresses a different behavior.
Pattern 03
They optimize for total revenue per session, not individual module performance
The question is not which module performs best on its own.
It is how all modules work together to increase total revenue per session.
A rewards bar may not convert directly, but it increases cart value. An add-on may convert frequently, but at a lower price point. An upsell may convert less often, but drive higher AOV.